Persons with Disabilities therapists in Windsor, CT
Browse Persons with Disabilities therapists in Windsor, Connecticut. Compare credentials, specialties and therapeutic approach. Contact a therapist to learn more.

Serving Persons with Disabilities
Powell Mental Health
Licensed Clinical Social Worker
We are devoted to individuals needing assistance pivoting their health and wellness journey. Our clinicians and certified trainers are diverse in their professional training, experiences, and backgrounds, with upwards of 25+ years of experience. Our goal is to offer personalized services and efficient treatment choices to meet your specific behavioral health and wellness requirements.
3 Years Experience
In-Person in Windsor, CT 06095
Online in Windsor, CT

Serving Persons with Disabilities
Psychotherapy.Com
Psychologist, Ph.D.
Virtual Visits Available Now!
30 Years Experience
Online in Windsor, CT
Serving Persons with Disabilities
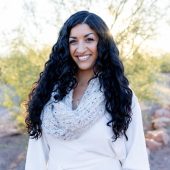
Dr. Amanda Malak
Psychologist, Clinical Psychologist
I believe people can build the lives they want to live by aligning themselves with their values, which may shift with the various seasons of life.
12 Years Experience
Online in Windsor, CT

Serving Persons with Disabilities
Stephanie Larsen @ Healthy Minds Psychology Group
Psychologist, PsyD
Hi! Congratulations on taking the first step in your journey of caring more deeply for yourself! I specialize in working with adolescents and young adults working to overcome their significant anxiety and free their life from constant worry. I also have specialized training in working with anxiety disorders such as OCD and Panic Disorder. Ultimately, I strongly believe in building a close therapeutic relationship where you can feel safe to explore and move past your anxious thought patterns, learn to support yourself, become more confident in your identity and purpose, and my goal is to help you achieve the goals you've set out to meet! Feel free to reach out and see if we can be a good fit to help move you closer to your goals and relief!
14 Years Experience
Online in Windsor, CT
Serving Persons with Disabilities
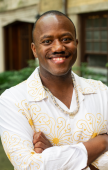
Alignment Psychotherapy, PLLC
Psychologist, LP, PhD
Our practice is grounded in a deep appreciation for the diverse experiences that shape each person’s life. Our founder grew up in Jamaica, Queens, surrounded and supported by three generations of remarkable women—an experience that continues to inform the values of care, resilience, and community that guide our work today. Across our practice, we have the privilege of supporting individuals from a wide range of cultural backgrounds, gender identities, and socioeconomic experiences, each bringing their own unique perspectives and concerns. As a practice founded by a Black, queer, first-generation college graduate, we hold a strong awareness of how power, privilege, and systemic forces shape daily life and mental health. We also recognize the vulnerability it takes to seek therapy. Our work is informed not only by clinical expertise, but by a deep respect for the courage and commitment involved in pursuing healing and meaningful change. This perspective shapes our intention to create a space that is thoughtful, affirming, and responsive to the full complexity of our clients’ lived experiences.
3 Years Experience
Online in Windsor, CT (Online Only)
Persons with Disabilities therapists in Windsor, CT Statistics
Persons with Disabilities therapists in Windsor, CT average 16 years of experience and charge around $226 per session. 100% offer online sessions. The most commonly treated issues are Anxiety or Fears (78%), Depression (70%), and Stress (59%).
Average years in practice
16 Years Experience
Average cost per session
$226
Accept insurance
37%
Offer sliding scale
42%
Gender ID
| 60% |
Female |
|
| 34% |
Male |
|
| 4% |
Non-Binary |
|
| 2% |
Gender Fluid |
|
Session Type
| 55% |
In Person and Online |
|
| 45% |
Online Only |
|
Top Specialties
| 78% | Anxiety or Fears |
| 70% | Depression |
| 59% | Stress |
| 58% | Loss or Grief |
| 56% | Self Esteem |
| 56% | Trauma and PTSD |
| 55% | ADHD |
Ages Served
| 99% | Adult |
| 82% | Young Adult |
| 68% | Senior |
| 44% | Teen |
| 26% | Children |
Client Focus
| 100% | Persons with Disabilities |
| 86% | Women |
| 73% | LGBTQ+ |
| 68% | Men |
| 58% | Military / Veterans |