Non-Binary therapists in Alton, Illinois IL
We are proud to feature top rated Non-Binary therapists in Alton. We encourage you to review each profile to find your best match.
Non-Binary
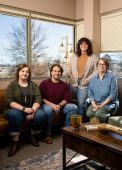
Better Together Mental Health
Licensed Clinical Social Worker, LCSW, LMSW
Finding the right therapist is important. When you find a therapist who understands your needs and can help you feel comfortable therapy is so much more effective. We will take the time to get to know you. We will help you meet your goals and make the changes you desire.
26 Years Experience
Online in Alton, IL Illinois
Non-Binary
Best Therapies, Inc.
Therapist
An inclusive group practice of Emotion Experts, Trauma-Informed Therapists, Gender Guides, and Sex-Positive Relationship Nerds, here to help.
7 Years Experience
Online in Alton, IL Illinois

Non-Binary
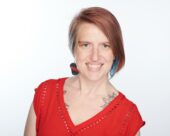
Mindful Healing Counseling
Psychologist, PsyD
We know life can be really tough at times, and it’s hard to figure out where to start when you feel stuck. Stress, anxiety, sadness, or relationship struggles can make everything seem harder, especially if you’re also dealing with past trauma or big life changes.
At Mindful Healing, we’re here to support you every step of the way. We believe that with the right support, you have the strength to heal and grow. Our goal is not just to listen, but to help lighten your burden and provide the tools you need to face life’s challenges. We are an inclusive practice, celebrating people of all identities and backgrounds. Our commitment is to create a safe space where you can feel seen, valued, and empowered to recognize your own strengths.
16 Years Experience
Online in Alton, IL Illinois (Online Only)
Non-Binary
Bold Expressions Therapy
Psychologist, Psy.D.
As a member of the LGBTQIA+ community, a trauma survivor, and someone with a chronic pain disorder; I approach the work that I do from a place of empathy and personal understanding. I have an intense passion for understanding personal identity and the way race, culture, class, and sexuality come together to form what we believe about ourselves and what we feel we can accomplish in our lives. Anxiety and trauma can live in our bodies - together we will create a relationship that fosters dynamic and lasting growth, tapping into undiscovered reserves of resiliency that will help navigate the past and prepare for a more hopeful future.
6 Years Experience
Online in Alton, IL Illinois

Non-Binary
Lincoln Park Psychology, Inc
Psychologist, Licensed Clinical Psychologists, LCPC, LPC, LCSW, LSW, CADC, AMFT
At Lincoln Park Psychology, we believe that the therapy process should provide results. Although we offer a range of services for a variety of populations, our goal-focused mindset never shifts. When clients come to LPP, our friendly, compassionate, affirming, and capable clinicians work with the client to develop goals that will set the client up for long-lasting change and a positive shift. It is also our firm belief that therapy should be as enjoyable as possible. Although "the work" can be hard, our clinicians are dedicated to forming a solid relationship built on commonalities, differences, openness, and humor.
17 Years Experience
Online in Alton, IL Illinois
Non-Binary therapists in Alton, Illinois Statistics
Non-Binary therapists in Alton, Illinois average 12 years of experience and charge around $178 per session. 100% offer online sessions. The most commonly treated issues are Anxiety or Fears (81%), LGBTQ+ Issues (81%), and Depression (75%).
Average years in practice
12 Years Experience
Average cost per session
$178
Accept insurance
69%
Offer sliding scale
44%
Gender ID
| 39% |
Non-Binary |
|
| 28% |
Female |
|
| 20% |
Male |
|
| 13% |
Gender Fluid |
|
Session Type
| 50% |
In Person and Online |
|
| 50% |
Online Only |
|
Top Specialties
| 81% | Anxiety or Fears |
| 81% | LGBTQ+ Issues |
| 75% | Depression |
| 56% | Trauma and PTSD |
| 56% | Relationship and Marriage Counseling |
| 56% | ADHD |
| 50% | Stress |
Ages Served
| 94% | Adult |
| 81% | Young Adult |
| 75% | Teen |
| 63% | Senior |
| 50% | Children |
Client Focus
| 94% | LGBTQ+ |
| 75% | Women |
| 44% | Persons with Disabilities |
| 38% | Black / African American |
| 38% | Hispanic / Latino |