LGBTQ+ Issues therapists in Corning, NY
Browse LGBTQ+ Issues therapists in Corning, New York. Compare credentials, specialties and therapeutic approach. Contact a therapist to learn more.
View nearby cities

LGBTQ+
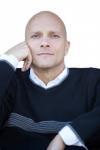
Daniel Pagano
Licensed Psychoanalyst, PhD, LP, SCC
Together we view your LGBTQIA+ identity as a vital expression of your soul's desire for wholeness. Stepping into your true self is a courageous act of individuation. Our Jungian work honors this journey, helping you integrate all aspects of your being for a life of purpose and self-acceptance. Your experience holds a unique spiritual potency—reflecting the sacred archetypal role of the bridge-builder—revealing a deeper, fluid truth about the human spirit. We transform challenges into creative and spiritual insight, celebrating your true Self. Embracing your full identity is a profound spiritual act. We provide a supportive space to navigate the interplay between personal truth and the collective shadow, fostering deep inner harmony and celebrating your divine uniqueness.
33 Years Experience
Online in Corning, NY
LGBTQ+
Robert dos Santos Teixeira
Licensed Clinical Social Worker, SMF, MPIA, MA, MSW, LCSW
Most sexual minorities have been deeply traumatized, and for many if not most, healing from that trauma is a life-long process.
22 Years Experience
Online in Corning, NY

LGBTQ+
Creative Now Therapy, Cris Maria Fort Garcés
Registered Psychotherapist, LCAT, ATR-BC, Gestalt Psychotherapy Certified, Developmental Somatic Psychotherapy Certified, Hakomi Somatic Practitioner
Navigating LGBTQ issues requires a therapist who understands the unique challenges and beauty of living authentically. I specialize in supporting queer, trans, and gender-expansive adults as they explore identity, relationships, and belonging. My approach is affirming, somatic, and culturally sensitive—offering a space where every part of you is welcome, from celebration to struggle. Together, we’ll honor your lived experience, untangle internalized shame, and help you step more confidently into your true self.
18 Years Experience
Online in Corning, NY (Online Only)
LGBTQ+
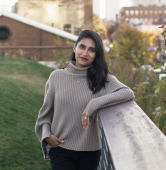
Farzana Rahman
Licensed Mental Health Counselor, LMHC-D
Over the years, I've gained extensive experience working with couples who are part of queer relationships, polyamory, and open-monogamy relationships. I have also worked with individuals who are exploring what their sexuality means to them and learning how to navigate disclosing their identity to family, partners, and/or friends. I welcome people to come as they are and we can understand your story together!
11 Years Experience
Online in Corning, NY
LGBTQ+
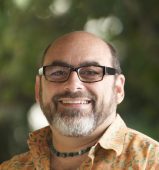
Eliot B. Altschul
Psychologist, Ph.D.
Exploring topics of sexuality, gender, and identity; coping with discrimination and oppression; navigating relationship, family, and cultural challenges. I am passionate about helping gay men heal from the negative messages that we received growing up that taught us that we are not okay as we are.
31 Years Experience
Online in Corning, NY (Online Only)
LGBTQ+ Issues therapists in Corning, NY Statistics
LGBTQ+ Issues therapists in Corning, NY average 15 years of experience and charge around $204 per session. 100% offer online sessions. The top treatment approaches are Cognitive Behavioral Therapy (CBT) (63%), Psychodynamic Therapy (45%), and Dialectical Behavior Therapy (DBT) (39%).
Average years in practice
15 Years Experience
Average cost per session
$204
Accept insurance
43%
Offer sliding scale
63%
Gender ID
| 59% |
Female |
|
| 29% |
Male |
|
| 8% |
Non-Binary |
|
| 4% |
Gender Fluid |
|
Session Type
| 62% |
In Person and Online |
|
| 38% |
Online Only |
|
Top Treatment Approaches
| 63% | Cognitive Behavioral Therapy (CBT) |
| 45% | Psychodynamic Therapy |
| 39% | Dialectical Behavior Therapy (DBT) |
| 33% | Relational Psychotherapy |
| 30% | Behavioral Therapy |
| 30% | Person-Centered Therapy (Rogerian) |
| 29% | Acceptance & Commitment Therapy (ACT) |
Ages Served
| 100% | Adult |
| 69% | Young Adult |
| 58% | Senior |
| 42% | Teen |
| 23% | Children |
Client Focus
| 82% | LGBTQ+ |
| 66% | Women |
| 47% | Men |
| 37% | Persons with Disabilities |
| 34% | Black / African American |