Native American therapists in Hanover, PA
Browse Native American therapists in Hanover, Pennsylvania. Compare credentials, specialties and therapeutic approach. Contact a therapist to learn more.

Serving Native American
Dr. Debra Laino Sexuaity and Relationship Consultation of Delaware, LLC
Therapist, DHS, M.S., M.ED, ASE
My practice is about the whole person. Holistic sex therapy is really understanding the biology, psychology, emotional, sexual, relational and social impacts on a person. Over 20 years of experience has lead me to explore many aspects of human beings and their sexual and relationship needs. Sex and Relationship therapy is a critical need to sustain a healthy relationship and a healthy sex life long term. I'm well known for getting straight to the point and take a solution focused and reality therapy approach to therapy.
25 Years Experience
Online in Hanover, PA

Serving Native American
Tara Murphy
Psychologist, Psy.D.
You may be used to keeping things together on the outside while feeling overwhelmed or not good enough inside. Maybe part of you feels responsible for everyone else, while another part is exhausted and wants a break. Or you want to feel close to others but find yourself pulling away when you feel vulnerable. I help people understand these different parts of themselves. Even the parts that criticize, shut down, or push you too hard often developed for reasons like helping you cope or protect you from being hurt.
My style is warm, down-to-earth, and collaborative. There’s room for whatever you’re feeling, including mixed feelings about change.
29 Years Experience
Online in Hanover, PA (Online Only)

Serving Native American
Full Being Services
Licensed Clinical Social Worker, LPC, LCSW, LAPC
We were founded to provide Black and Brown people with quality services. Through a culturally responsive lens, we help you find your sense of self, make sense of your past, work through past trauma, and connect with yourself and the world around you. Let's work together to help you reach your goals.
15 Years Experience
Online in Hanover, PA
Serving Native American
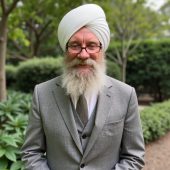
Karambir Khalsa | Khalsa Psychology PLLC
Psychologist, (AZ PSY-005603), Non-Licensed Clinician (CO NLC.0107000)
I create a safe place for you to process your concerns and heal. Sessions are conversational in nature. I want to hear your concerns in your own words and I will reflect back what I am hearing so you can confirm or correct. Our conversations help me to know which techniques are relevant and applicable to your concerns.
3 Years Experience
Online in Hanover, PA
Serving Native American
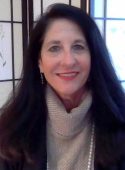
Dr. Carol H Paulson
Psychologist, PhD, LP, RN, APRN, DMin
Dr. Carol brings many years of experience in healthcare and mental health care, along with a broad range of therapeutic approaches and a holistic perspective. As a compassionate and engaged therapist, she helps clients explore the deeper patterns shaping their lives and learn to work with their strengths to find one's best life. Her areas of focus include depth psychology, inner work, nervous-system regulation, attachment concerns, repetitive patterns, trauma recovery, healthier thinking and living, and the emotional impact of medical issues.
44 Years Experience
Online in Hanover, PA (Online Only)
Native American therapists in Hanover, PA Statistics
Native American therapists in Hanover, PA average 18 years of experience and charge around $246 per session. 100% offer online sessions. The most commonly treated issues are Anxiety or Fears (84%), Depression (77%), and Loss or Grief (72%).
Average years in practice
18 Years Experience
Average cost per session
$246
Accept insurance
33%
Offer sliding scale
40%
Gender ID
| 67% |
Female |
|
| 29% |
Male |
|
| 2% |
Gender Fluid |
|
| 2% |
Non-Binary |
|
Session Type
| 58% |
Online Only |
|
| 42% |
In Person and Online |
|
Top Specialties
| 84% | Anxiety or Fears |
| 77% | Depression |
| 72% | Loss or Grief |
| 63% | Trauma and PTSD |
| 60% | Self Esteem |
| 53% | Stress |
| 49% | Divorce |
Ages Served
| 100% | Adult |
| 88% | Young Adult |
| 74% | Senior |
| 33% | Teen |
| 16% | Children |
Client Focus
| 100% | Native American |
| 95% | Women |
| 91% | Hispanic / Latino |
| 84% | Black / African American |
| 79% | Asian |