Non-Binary therapists in Rutland, VT
Browse Non-Binary therapists in Rutland, Vermont. Compare credentials, specialties and therapeutic approach. Contact a therapist to learn more.
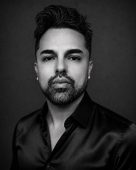
Non-Binary
Vincent Espinoza
Licensed Clinical Social Worker, LCSW
My therapy practice is focused on YOU, first and foremost! I believe we are all unique and a culmination of our values, desires, experiences and our untapped potential. My mission as a mental health clinician is to help my clients learn how to talk about sex in a healthy, unapologetic, sex-positive way and to confront and address past trauma so they can move into the present and enjoy a fulfilling life.
12 Years Experience
Online in Rutland, VT (Online Only)
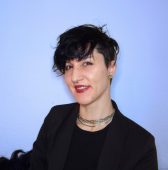
Non-Binary
Molly Toomey
Licensed Clinical Social Worker, LCSW
To all those who don't fit neatly into society's norms of gender, sexuality, relationships, and cultures—this is a space for you! As a queer neurodivergent person and immigrant, I'm deeply passionate about connecting my communities to affirming, accessible mental health care. I've helped hundreds of people to get "un-stuck" from difficult pasts and repetitive cycles and to move toward clarity, connection, community, and a life they enjoy living. I'd love to help you on your own journey forward, with me by your side as your ally and co-conspirator.
9 Years Experience
Online in Rutland, VT (Online Only)
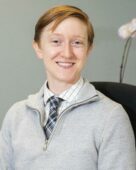
Non-Binary
Dr. Caroline Hicks
Psychologist, PhD, LP
You deserve a space where you don’t have to explain or shrink who you are. I work from a queer-affirming, trans-affirming, and trauma-informed lens to support individuals navigating identity, transition, relationships, and major life changes. Many of my clients come in feeling overwhelmed, disconnected from their authenticity, or unsure of the next step. Together we create space to slow down, explore, and reconnect with yourself.
My approach is warm, collaborative, and grounded in empowerment. Whether you're questioning, in transition, or working through old patterns, I’m here to support you in building a life that feels aligned with your truth. Therapy with me isn’t about “fixing” you. It’s about helping you feel seen, grounded, and understood.
9 Years Experience
Online in Rutland, VT (Online Only)

Non-Binary
Mind Body Connections
Counselor/Therapist
Mind Body Connections is a group practice with locations in Naperville and Chicago, and the professional home of 10 highly skilled therapists each in their areas of expertise. We believe in the importance of identifying and attending to the root cause of the issues that brought you to seek therapy at this time. By working with us, you will gain skills to support yourself outside of the therapy hour and feel more empowered to tackle life's challenges. As the owner of Mind Body Connections, I will personally do your intake within less than 48 hours and place you with the clinician that will best meet your needs.
28 Years Experience
Online in Rutland, VT

Non-Binary
Catherine Bitney
Psychologist, PhD, Licensed Psychologist
I have a passion for helping clients reduce anxiety, stress, confusion, sadness, and pain - so that they can live more fulfilling, authentic, and happy lives. Many of my clients have stated that coming to therapy has helped to catapult them out of their stagnation - enabling them to reach their full potential. For clients who have had difficulty finding a therapist who can understand their complex and intersecting identities, I can be a breath of fresh air. I work with folks ages 15 and up.
15 Years Experience
Online in Rutland, VT (Online Only)
Non-Binary therapists in Rutland, VT Statistics
Non-Binary therapists in Rutland, VT average 11 years of experience and charge around $192 per session. 100% offer online sessions. The most commonly treated issues are LGBTQ+ Issues (80%), ADHD (70%), and Anxiety or Fears (70%).
Average years in practice
11 Years Experience
Average cost per session
$192
Accept insurance
60%
Offer sliding scale
40%
Gender ID
| 40% |
Non-Binary |
|
| 28% |
Female |
|
| 20% |
Male |
|
| 12% |
Gender Fluid |
|
Session Type
| 80% |
Online Only |
|
| 20% |
In Person and Online |
|
Top Specialties
| 80% | LGBTQ+ Issues |
| 70% | ADHD |
| 70% | Anxiety or Fears |
| 70% | Depression |
| 70% | Trauma and PTSD |
| 50% | Autism and Asperger's |
| 50% | Social Anxiety |
Ages Served
| 90% | Adult |
| 90% | Young Adult |
| 60% | Senior |
| 50% | Teen |
| 30% | Children |
Client Focus
| 90% | LGBTQ+ |
| 80% | Women |
| 50% | Hispanic / Latino |
| 40% | Black / African American |
| 40% | Persons with Disabilities |