LGBTQ+ Issues therapists in Fort Collins, CO
Browse LGBTQ+ Issues therapists in Fort Collins, Colorado. Compare credentials, specialties and therapeutic approach. Contact a therapist to learn more.
LGBTQ+
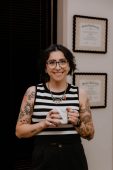
Ry Shavlik
Counselor/Therapist, MSW, LSW
I focus on all challenges with being queer: societal pressures, identity exploration/acceptance, finding community, and more.
6 Years Experience
In-Person in Fort Collins, CO 80526
Online in Fort Collins, CO
LGBTQ+
Empowering Hope
Marriage and Family Therapist, Rachel LMFT, Kady MFTC, Jessica LPCC, Johanna LPCC, Emily LPCC, Andrea intern
All of our team members are LGBTQAI+ affirming and are honored to support you in self acceptance, exploration, and processing.
6 Years Experience
In-Person in Fort Collins, CO 80526
Online in Fort Collins, CO
LGBTQ+
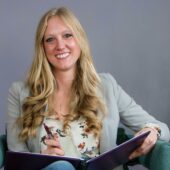
Dr. Tasha Seiter
Marriage and Family Therapist, MS, PhD, LMFT
I love working with LGBTQ+ clients and couples.
9 Years Experience
In-Person in Fort Collins, CO 80524
Online in Fort Collins, CO

LGBTQ+
Dr. Stacie McPherson
Psychologist, M.A., Psy.D., Licensed Psychologist
LGBTQ+ individuals often carry experiences that shape mental health in specific ways such as: minority stress, family rejection, microaggressions, the labor of coming out repeatedly, and navigating a world that still requires extra vigilance. I provide affirming therapy for queer and trans adults, with expertise in identity exploration, relationship concerns, trauma, and the intersection of LGBTQ+ identity with anxiety, depression, and trauma. As a queer psychologist I bring both lived understanding and clinical depth to this work.
10 Years Experience
Online in Fort Collins, CO (Online Only)

LGBTQ+
Mackson Psychology
Psychologist, Samantha Mackson, Psy.D.
Navigating identity, relationships, family dynamics, and societal expectations can bring unique challenges for LGBTQ+ individuals. I provide a supportive, affirming space to explore these experiences, build self-acceptance, and work through anxiety, relationship concerns, and other challenges that may arise.
6 Years Experience
Online in Fort Collins, CO (Online Only)
LGBTQ+ Issues therapists in Fort Collins, CO Statistics
LGBTQ+ Issues therapists in Fort Collins, CO average 14 years of experience and charge around $200 per session. 100% offer online sessions. The top treatment approaches are Cognitive Behavioral Therapy (CBT) (68%), Person-Centered Therapy (Rogerian) (39%), and Acceptance & Commitment Therapy (ACT) (38%).
Average years in practice
14 Years Experience
Average cost per session
$200
Accept insurance
43%
Offer sliding scale
37%
Gender ID
| 59% |
Female |
|
| 30% |
Male |
|
| 7% |
Non-Binary |
|
| 4% |
Gender Fluid |
|
Session Type
| 55% |
In Person and Online |
|
| 45% |
Online Only |
|
Top Treatment Approaches
| 68% | Cognitive Behavioral Therapy (CBT) |
| 39% | Person-Centered Therapy (Rogerian) |
| 38% | Acceptance & Commitment Therapy (ACT) |
| 36% | Psychodynamic Therapy |
| 33% | Emotionally Focused Therapy (EFT) |
| 33% | Existential / Humanistic Therapy |
| 32% | Dialectical Behavior Therapy (DBT) |
Ages Served
| 99% | Adult |
| 75% | Young Adult |
| 50% | Senior |
| 40% | Teen |
| 19% | Children |
Client Focus
| 83% | LGBTQ+ |
| 65% | Women |
| 48% | Men |
| 32% | Black / African American |
| 32% | Hispanic / Latino |