Native American therapists in Putnam, CT
Browse Native American therapists in Putnam, Connecticut. Compare credentials, specialties and therapeutic approach. Contact a therapist to learn more.

Serving Native American
Dr. Fatuma Dzilala
Psychologist, PsyD
You spend so much time showing up for everyone else, but when was the last time you truly showed up for yourself? Whether you're struggling with anxiety, navigating difficult relationships, feeling stuck in life, or simply wanting to understand yourself better, you deserve a space to focus on you. I'm a licensed clinical psychologist passionate about helping women feel more confident, emotionally grounded, and empowered to create meaningful change. My approach is warm, collaborative, and culturally responsive, with room for both honest conversations and laughter along the way. You don't have to figure everything out on your own. Let's connect!
8 Years Experience
Online in Putnam, CT (Online Only)

Serving Native American
Samantha Allison-Evans, M.A., LPC
Licensed Mental Health Counselor, M.A., LPC
"At Allison Evans Counseling & Consulting, PLLC , our mission is to heal, empower, and transform lives through compassionate counseling services. We strive to empower individuals to reach their full potential and make positive changes in their lives. Our ultimate goal is to help clients achieve personal growth, overcome challenges, and find lasting happiness and fulfillment."
11 Years Experience
Online in Putnam, CT (Online Only)

Serving Native American
Ingrid Sthare
Life Coach, CTLC, BCC
Considering Divorce? Please call me before you call an attorney! What can seem like you're heading for a break up can be a breakthrough to a deeper connection; despite infidelity, loss of a child or lack of intimacy. You are perhaps feeling shame or anger and you're anxious to take the first step; yet you want to try everything for yourself and your family. Maybe you've tried other methods such as marriage counseling to no avail. Please call for a free consult! Or you're looking to rebuild after a breakup and feel like you've lost yourself. My premarital work helps curb divorce stats! Prefer a 100% confidential
therapeutic process from the start? Most relationship issues do not involve a mental health diagnosis. Rather, you’ve adapted to and from broken models. Through relationship education you will learn new models and tools to equip yourself for the relationship you want with yourself or someone else.
15 Years Experience
Online in Putnam, CT
Serving Native American
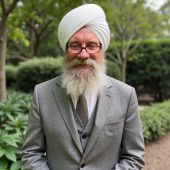
Karambir Khalsa | Khalsa Psychology PLLC
Psychologist, (AZ PSY-005603), Non-Licensed Clinician (CO NLC.0107000)
I create a safe place for you to process your concerns and heal. Sessions are conversational in nature. I want to hear your concerns in your own words and I will reflect back what I am hearing so you can confirm or correct. Our conversations help me to know which techniques are relevant and applicable to your concerns.
3 Years Experience
Online in Putnam, CT

Serving Native American
Dr. Stéphanie Gamache, PhD
Hypnotherapist, PhD
Something in you knows that what you're carrying runs deeper than the presenting problem.
Many of the people I work with are thoughtful, capable, and outwardly composed-yet internally they live with anxiety, depression, chronic tension or pain, relentless self-criticism, or a sense that something essential is blocked, muted, or just out of reach. These struggles may surface in mood, in the body, in behavior, or in relationships-including sexuality and intimacy-but they are rarely contained to any one area. They tend to reflect deeper emotional and relational patterns formed early in life, often before language, that continue to shape how a person approaches closeness, vulnerability, agency, pleasure, and self-expression.
My work centers on how early experience shapes the capacity for self-regulation, desire, connection, and meaning throughout life-and particularly on how people come to know what they need and want, how they learn to express or inhibit those impulses, and what happens when these capacities become conflicted, constricted, or difficult to sustain.
I integrate psychoanalytic hypnotherapy, somatic awareness, and clinical sexology within a reflective, depth-oriented process. Hypnosis functions as a central clinical tool-creating conditions for deeper internal contact with emotional, bodily, and unconscious experience that can be difficult to reach through conversation alone. The aim is not only relief from symptoms, but the development of a more coherent and compassionate relationship with one's inner life: sensations, emotions, impulses, and desires.
This work is oriented toward lasting psychological change-and toward greater freedom in how one relates to oneself, one's body, and one's capacity for connection, authenticity, and vitality. It is best suited to those ready to move beyond symptom management toward something more fundamental.
7 Years Experience
Online in Putnam, CT (Online Only)
Native American therapists in Putnam, CT Statistics
Native American therapists in Putnam, CT average 17 years of experience and charge around $239 per session. 100% offer online sessions. The most commonly treated issues are Anxiety or Fears (88%), Depression (79%), and Loss or Grief (70%).
Average years in practice
17 Years Experience
Average cost per session
$239
Accept insurance
35%
Offer sliding scale
40%
Gender ID
| 67% |
Female |
|
| 29% |
Male |
|
| 2% |
Gender Fluid |
|
| 2% |
Non-Binary |
|
Session Type
| 56% |
Online Only |
|
| 44% |
In Person and Online |
|
Top Specialties
| 88% | Anxiety or Fears |
| 79% | Depression |
| 70% | Loss or Grief |
| 67% | Trauma and PTSD |
| 60% | Self Esteem |
| 51% | Divorce |
| 51% | Stress |
Ages Served
| 100% | Adult |
| 91% | Young Adult |
| 74% | Senior |
| 35% | Teen |
| 16% | Children |
Client Focus
| 100% | Native American |
| 95% | Women |
| 91% | Hispanic / Latino |
| 84% | Black / African American |
| 79% | Asian |