Bipolar Disorder therapists in Columbus, GA
Browse Bipolar Disorder therapists in Columbus, Georgia. Compare credentials, specialties and therapeutic approach. Contact a therapist to learn more.
View nearby cities

Bipolar
Cheryl S Rubenstein
Psychologist, PhD
Bipolar disorder is a particularly complex disorder, but working together, we can help even out your moods and help you feel and function better. Often it is helpful to coordinate care with a psychiatrist.
19 Years Experience
Online in Columbus, GA

Bipolar
Meraki Health
Psychiatric Nurse Practitioner, Ph.D., MBA, MSN, PMHNP-BC, FNP-C,
Specializing in Bipolar Disorder, Meraki Health provides individualized care to help patients manage mood swings, episodes of depression, and periods of elevated or irritable mood. Treatment combines psychiatric evaluation, medication management, and supportive therapy to stabilize mood, improve daily functioning, and promote long-term emotional balance and resilience.
6 Years Experience
Online in Columbus, GA (Online Only)

Bipolar
Hosea Counseling Services, LLC
Licensed Professional Counselor, LPC, EMDR Therapist
Hosea Counseling Services specializes with helping her clients learn to manage bipolar symptoms through compassion and understanding along with therapy modalities that will reduce symptoms.
11 Years Experience
Online in Columbus, GA
Bipolar
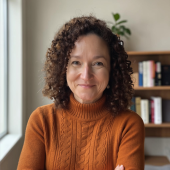
Maria Elena Lara, Ph.D. LLC
Psychologist, Ph.D.
I utilize the latest research-backed information and therapy techniques to assist adolescents and adults with the challenges experienced with Bipolar Disorder, including but not limited to behavior rehearsal, cognitive reframing, coping strategies, assertiveness, communications skills, crisis resolution, emotional containment, homework, interpersonal skills, problem solving, stress reduction, and recommended reading, all within a cognitive-behavioral therapeutic framework
26 Years Experience
Online in Columbus, GA
Bipolar
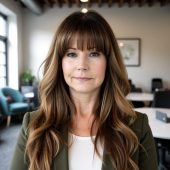
Cheryl Laurenza
Counselor/Therapist, LCMHC, LPC, NCC, ACS, BCPCC
Are you trying to manage your Bipolar with just RX only? You may benefit from structure and support
25 Years Experience
Online in Columbus, GA (Online Only)
Columbus, Georgia is home to Fort Benning — one of the US Army's largest installations and the home of the Army Infantry — creating a therapy community substantially shaped by the needs of soldiers, veterans, and military families dealing with combat trauma, moral injury, PTSD, and the emotional complexity of service life. The city's African American population comprises the largest share of the civilian community, and culturally affirming therapists who work with racial identity and intergenerational resilience alongside the predominantly military therapy demand are an important part of the local landscape. Martin Army Community Hospital serves the military population, while Piedmont Columbus Regional provides civilian institutional mental health resources. Columbus shares some of its therapy ecosystem with Phenix City, Alabama directly across the Chattahoochee River, giving the metro a bi-state character.
Bipolar Disorder therapists in Columbus, GA Statistics
Bipolar Disorder therapists in Columbus, GA average 17 years of experience and charge around $198 per session. 100% offer online sessions. The top treatment approaches are Cognitive Behavioral Therapy (CBT) (76%), Person-Centered Therapy (Rogerian) (42%), and Psychodynamic Therapy (39%).
Average years in practice
17 Years Experience
Average cost per session
$198
Accept insurance
66%
Offer sliding scale
39%
Gender ID
| 64% |
Female |
|
| 33% |
Male |
|
| 3% |
Non-Binary |
|
Session Type
| 63% |
In Person and Online |
|
| 37% |
Online Only |
|
Top Treatment Approaches
| 76% | Cognitive Behavioral Therapy (CBT) |
| 42% | Person-Centered Therapy (Rogerian) |
| 39% | Psychodynamic Therapy |
| 37% | Eclectic Therapy |
| 34% | Behavioral Therapy |
| 32% | Dialectical Behavior Therapy (DBT) |
| 32% | Emotionally Focused Therapy (EFT) |
Ages Served
| 97% | Adult |
| 75% | Young Adult |
| 54% | Senior |
| 47% | Teen |
| 20% | Children |
Client Focus
| 59% | Women |
| 51% | Men |
| 42% | LGBTQ+ |
| 36% | Christian |
| 34% | Black / African American |