Interpersonal Therapy (IPT) therapists in Upper Alton, IL
Browse Interpersonal Therapy (IPT) therapists in Upper Alton, Illinois. Compare credentials, specialties and therapeutic approach. Contact a therapist to learn more.

IPT
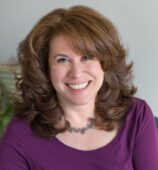
Meg Lukan
Licensed Professional Counselor, MS, LCPC
Hi, I'm Meg! I help capable, driven people pause, untangle what’s been weighing them down, and find their way back to a version of themselves that feels clearer, lighter, and more grounded. Many of my clients look "fine" on the outside but may be dealing with overwhelming and anxious feelings they aren't quite sure how to navigate. With over three decades of experience in counseling, I bring my humor, positive attitude, and clinical experience to encourage clients to embrace their struggles, understand their patterns, and shift their mindsets.
35 Years Experience
Online in Upper Alton, IL
IPT
Lee Chase
Psychologist, Ph.D.
Dr. Chase emphasizes creating a supportive and interactive therapeutic environment that encourages self-exploration, reflection, and problem-solving. She combines compassion, strong attunement, and a sense of humor in her work.
32 Years Experience
Online in Upper Alton, IL

IPT
Rick Tivers
Licensed Clinical Social Worker, LCSW, CGP
I am known as a therapists' therapist due to my strong diagnostic skills and highly engaging style and ability to provide corrective emotional experiences to my clients. I develop real , authentic relationships with my clients to help heal pain, recover from shame, and to produce healthy, non-sabotaging behaviors.
45 Years Experience
Online in Upper Alton, IL
IPT
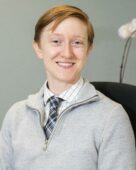
Dr. Caroline Hicks
Psychologist, PhD, LP
You deserve a space where you don’t have to explain or shrink who you are. I work from a queer-affirming, trans-affirming, and trauma-informed lens to support individuals navigating identity, transition, relationships, and major life changes. Many of my clients come in feeling overwhelmed, disconnected from their authenticity, or unsure of the next step. Together we create space to slow down, explore, and reconnect with yourself.
My approach is warm, collaborative, and grounded in empowerment. Whether you're questioning, in transition, or working through old patterns, I’m here to support you in building a life that feels aligned with your truth. Therapy with me isn’t about “fixing” you. It’s about helping you feel seen, grounded, and understood.
9 Years Experience
Online in Upper Alton, IL (Online Only)

IPT
Mary Mesiha
Licensed Clinical Social Worker, LICSW
I’m Mary Mesiha, a Licensed Independent Clinical Social Worker with over 20 years of experience helping people navigate life’s challenges. Since beginning my career in 1999, I’ve had the privilege of working with people from many different backgrounds across a range of settings-which shaped my approach to therapy.
I work with individuals dealing with depression, anxiety, trauma, abuse, and issues related to adoption. My goal is to meet you where you are and help you make sense of what you are going through in a meaningful and manageable way.
I am licensed to practice in Massachusetts, Connecticut, Florida, and Illinois.
27 Years Experience
Online in Upper Alton, IL (Online Only)
Interpersonal Therapy (IPT) therapists in Upper Alton, IL Statistics
Interpersonal Therapy (IPT) therapists in Upper Alton, IL average 18 years of experience and charge around $204 per session. 100% offer online sessions. The most commonly treated issues are Anxiety or Fears (82%), Depression (67%), and Stress (62%).
Average years in practice
18 Years Experience
Average cost per session
$204
Accept insurance
43%
Offer sliding scale
36%
Gender ID
| 69% |
Female |
|
| 27% |
Male |
|
| 2% |
Non-Binary |
|
| 2% |
Gender Fluid |
|
Session Type
| 60% |
In Person and Online |
|
| 40% |
Online Only |
|
Top Specialties
| 82% | Anxiety or Fears |
| 67% | Depression |
| 62% | Stress |
| 52% | Self Esteem |
| 52% | Trauma and PTSD |
| 50% | Loss or Grief |
| 44% | Social Anxiety |
Ages Served
| 98% | Adult |
| 69% | Young Adult |
| 49% | Senior |
| 36% | Teen |
| 22% | Children |
Client Focus
| 53% | Women |
| 43% | LGBTQ+ |
| 37% | Men |
| 25% | Military / Veterans |
| 25% | Black / African American |