LGBTQ+ therapists in Urbana, IL
Browse LGBTQ+ therapists in Urbana, Illinois. Compare credentials, specialties and therapeutic approach. Contact a therapist to learn more.
View nearby cities

Serving LGBTQ+
Danielle Keys at Headway
Licensed Mental Health Counselor, M.S.ED, LCPC
I am a legally-blind counselor who listens carefully to client's needs to determine what works and what may not be effective. A collaborative approach is used to meet your needs. If you prefer a direct and interactive clinician that is my style. However, I'm flexible and integrate client preferences to achieve clients goals.
11 Years Experience
Online in Urbana, IL (Online Only)

Serving LGBTQ+
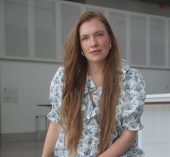
Lawisha Dulski
Counselor/Therapist, MS, LCPC, NCC
I believe in a person centered and narrative approach, as you are the expert of your own life. You
have your own story to tell. Talking to a stranger about issues you’re facing can be extremely
difficult and challenging but it shows enormous amounts of strength and bravery.
My goal as a therapist is to provide a safe, nonjudgmental space where you can express yourself,
discuss challenges that you are facing, explore new ideas and new chapters, and to help promote
growth and wellness. I want my clients to feel heard and understood.
10 Years Experience
In-Person Near Urbana, IL
Online in Urbana, IL
Serving LGBTQ+
Emily Hurlin
Licensed Clinical Social Worker, LISW, LCSW
Most couples who reach out to me have already tried talking it through, sometimes for years, and they're worn out from having the same fight in slightly different words. I work differently. Drawing on PACT, Somatic Experiencing, and EMDR, I help partners notice what's happening in their bodies and nervous systems when things go sideways, so change sticks where insight alone hasn't. I work with betrayal, gridlocked conflict, intimacy struggles, blended families, and couples preparing for marriage. If you're ready for something more than communication tips, I'd be glad to hear from you.
8 Years Experience
Online in Urbana, IL (Online Only)

Serving LGBTQ+
Illana Jordan
Therapist, LCSW
For some, therapy is an opportunity to explore complex and overlapping parts of themselves. For others, it is an opportunity to better understand the impact their past is having on their current life circumstances. For each us, therapy should be an opportunity to be heard, to heal and feel better.
16 Years Experience
Online in Urbana, IL (Online Only)
Serving LGBTQ+
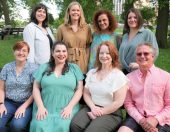
Bravura Therapy
Counselor/Therapist, LMFT, LCSW, LCPC
Bravura Therapy takes pride in helping clients find their own bravery. Whether responding to overwhelming life challenges, building toward a brighter future, or understanding why you are the way you are, your growth matters to us. Each therapist brings their individual experience, curiosity and special training to session, but we are all humans first. We want to connect with you so you can strengthen your own connections. Bravura offers therapy for kids, teens, families, adults, couples, and seniors. Reach out and let us match you with a therapist that will see and hear your story and help write the next chapter. Getting started with therapy can feel overwhelming, but you can take that first brave step.
14 Years Experience
Online in Urbana, IL
LGBTQ+ therapists in Urbana, IL Statistics
LGBTQ+ therapists in Urbana, IL average 15 years of experience and charge around $209 per session. 100% offer online sessions. The most commonly treated issues are Anxiety or Fears (83%), Depression (66%), and Trauma and PTSD (61%).
Average years in practice
15 Years Experience
Average cost per session
$209
Accept insurance
45%
Offer sliding scale
40%
Gender ID
| 63% |
Female |
|
| 28% |
Male |
|
| 5% |
Non-Binary |
|
| 4% |
Gender Fluid |
|
Session Type
| 56% |
In Person and Online |
|
| 44% |
Online Only |
|
Top Specialties
| 83% | Anxiety or Fears |
| 66% | Depression |
| 61% | Trauma and PTSD |
| 59% | LGBTQ+ Issues |
| 56% | Stress |
| 54% | Loss or Grief |
| 49% | Self Esteem |
Ages Served
| 99% | Adult |
| 77% | Young Adult |
| 59% | Senior |
| 41% | Teen |
| 20% | Children |
Client Focus
| 100% | LGBTQ+ |
| 82% | Women |
| 61% | Men |
| 41% | Black / African American |
| 38% | Hispanic / Latino |