LGBTQ+ Issues therapists in Fort Wayne, IN
Browse LGBTQ+ Issues therapists in Fort Wayne, Indiana. Compare credentials, specialties and therapeutic approach. Contact a therapist to learn more.
LGBTQ+
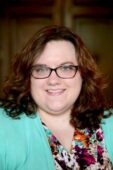
Andrea Barbour
Marriage and Family Therapist, MA, LMFT, PhD(ABD)
The LGBTQ/ Poly/ Kink community is important to me. I have a deep appreciation and value for the unique challenges and struggles that can impact this community. My aim to provide the safe, open space you need to find direction and meaning as well as feeling empowered to be who you are.
12 Years Experience
Online in Fort Wayne, IN
LGBTQ+
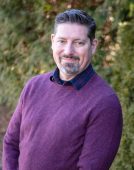
Jason Herr
Psychologist, Psy.D.
I provide affirming support for LGBTQ+ individuals exploring identity, relationships, and life transitions. Together, we address challenges such as coming out, family dynamics, discrimination, and self-acceptance while strengthening resilience, authenticity, and emotional well-being. My approach is inclusive, compassionate, and grounded in creating a safe space for clients to live fully as themselves.
16 Years Experience
Online in Fort Wayne, IN (Online Only)
LGBTQ+
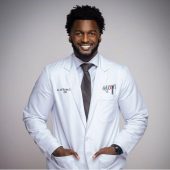
Dr. Jeff J. Rocker
Licensed Mental Health Counselor, PH.D, NCC, LMHC, LCPC, LPC
Rocker Health has experienced and competent staff to deal with these issues.
15 Years Experience
Online in Fort Wayne, IN
LGBTQ+
Amber McKinney-Morgan
Licensed Clinical Social Worker, LCSW, LICSW
I provide affirming, inclusive care for LGBTQ+ individuals navigating identity, relationships, family dynamics, and societal stressors. My approach recognizes the impact of systemic oppression while also supporting personal growth, self-acceptance, and connection. Therapy is a space where all parts of you are welcome and understood.
8 Years Experience
Online in Fort Wayne, IN (Online Only)

LGBTQ+
Catherine Bitney
Psychologist, PhD, Licensed Psychologist
As a queer, nonbinary individual, I have a soft spot for the LGBTQ++ community and about half my clients identify as sexual or gender diverse. As a university professor, I enjoy working within a professional setting to show students that you can be accepted, celebrated, successful, etc. as a queer and gender nonconforming professional.
15 Years Experience
Online in Fort Wayne, IN (Online Only)
Fort Wayne is Indiana's second-largest city and a hub for defense manufacturing, healthcare, and distribution logistics — an occupational mix that shapes a therapy culture in which shift work stress, workplace injury adjustment, and career identity are common themes. The city has a significant Burmese refugee community — one of the largest in the United States — creating important demand for therapists with cultural competence around refugee trauma, resettlement stress, and the challenges of navigating American systems. Parkview Health and Lutheran Health Network provide major institutional mental health resources alongside a private practice community. Fort Wayne's conservative faith community means spiritually integrated approaches are a prominent feature of the local therapy offering.
LGBTQ+ Issues therapists in Fort Wayne, IN Statistics
LGBTQ+ Issues therapists in Fort Wayne, IN average 15 years of experience and charge around $210 per session. 100% offer online sessions. The top treatment approaches are Cognitive Behavioral Therapy (CBT) (75%), Acceptance & Commitment Therapy (ACT) (42%), and Emotionally Focused Therapy (EFT) (36%).
Average years in practice
15 Years Experience
Average cost per session
$210
Accept insurance
36%
Offer sliding scale
39%
Gender ID
| 59% |
Female |
|
| 31% |
Male |
|
| 6% |
Non-Binary |
|
| 4% |
Gender Fluid |
|
Session Type
| 58% |
In Person and Online |
|
| 42% |
Online Only |
|
Top Treatment Approaches
| 75% | Cognitive Behavioral Therapy (CBT) |
| 42% | Acceptance & Commitment Therapy (ACT) |
| 36% | Emotionally Focused Therapy (EFT) |
| 36% | Multicultural Therapy |
| 36% | Psychodynamic Therapy |
| 34% | Existential / Humanistic Therapy |
| 31% | Family Systems Therapy |
Ages Served
| 99% | Adult |
| 78% | Young Adult |
| 54% | Senior |
| 43% | Teen |
| 21% | Children |
Client Focus
| 80% | LGBTQ+ |
| 60% | Women |
| 51% | Men |
| 33% | Black / African American |
| 33% | Hispanic / Latino |