Middle Eastern therapists in Saint Charles, MD
Browse Middle Eastern therapists in Saint Charles, Maryland. Compare credentials, specialties and therapeutic approach. Contact a therapist to learn more.
Serving Middle Eastern
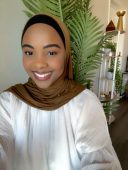
Dr. Fatuma Dzilala
Psychologist, PsyD
You spend so much time showing up for everyone else, but when was the last time you truly showed up for yourself? Whether you're struggling with anxiety, navigating difficult relationships, feeling stuck in life, or simply wanting to understand yourself better, you deserve a space to focus on you. I'm a licensed clinical psychologist passionate about helping women feel more confident, emotionally grounded, and empowered to create meaningful change. My approach is warm, collaborative, and culturally responsive, with room for both honest conversations and laughter along the way. You don't have to figure everything out on your own. Let's connect!
8 Years Experience
Online in Saint Charles, MD (Online Only)
Serving Middle Eastern
Georgina Arhin
Licensed Professional Counselor, LCPC, LPC, ACS, CCTP
There is nothing like being listened to and understood on a deep level, with genuine interest, unconditional positive regard, congruence, empathy and acceptance. This is what I strive to offer in therapy, as we explore together your hopes and dreams, your losses and regrets, your longings and fears. My goal is to create a safe and welcoming environment where you can truly feel supported,encouraged and empowered
23 Years Experience
Online in Saint Charles, MD (Online Only)

Serving Middle Eastern
Dr. Samira Paul Olive Tree Psychology Clinic LLC
Psychologist, PsyD
At Olive Tree Psychology Clinic LLC, we believe that healing requires entering a space where you feel truly seen, understood, and respected. We honor your presence and we meet you exactly where you are.
7 Years Experience
Online in Saint Charles, MD (Online Only)

Serving Middle Eastern
Denise Jones
Licensed Clinical Social Worker, LICSW, LCSW-C
If you've landed here, welcome! You're reading the bio of a practitioner who exclusively offers EMDR (Eye Movement Desensitization and Reprocessing) therapy. Unlike other therapists who may take an EMDR class or two, I am a Certified EMDR Therapist as well as a consultant for other professionals who want to strengthen their skills using this evidence-based modality. I stay actively connected to a national and international network of professionals who are dedicated to EMDR treatment and research; my colleagues describe me as thoughtful in the construction and conceptualization of client treatment goals. They also note that I can effectively integrate EMDR with other modalities as warranted. It's my hope your finding this information will lead you to think EMDR may be the right treatment - and I may be the right therapist - for you!
15 Years Experience
Online in Saint Charles, MD (Online Only)

Serving Middle Eastern
Laura Goldstein
Marriage and Family Therapist, LCMFT
Hello, I’m Laura Goldstein! I am a licensed clinical marriage and family therapist in North Bethesda MD and I founded Montgomery County Counseling Center, LLC in 2017. My work in this field started first and foremost because of my passion for family therapy! Nothing happens in a vacuum of just one person. Sustainable change can only occur when the entire system shifts. Therefore, whether or not the entire family is in the therapy space, we must still consider the whole family’s relationship dynamics.
Because of this perspective, I can work with anyone: individuals, couples, and families. Clients are the experts in their own lives. So, my goal is to create a safe and non-judgemental space for them to explore the issues that matter most to them. However, I also believe that clients come to therapy looking for expertise. If what you were doing on your own was already working, you wouldn’t be here. Therefore, I take a rather directive approach to helping my clients learn skills to be successful in managing distress and/or conflict.
What does that mean exactly?
Well, as a therapist I won't tell you what to do or what not to do. But, I can shine a light on your patterns and bring attention to the areas where you can make different choices [no matter whatever anyone else around you is doing]. I’m a “no BS” kinda gal. Authenticity is key! This means sometimes hearing the things that are hard to hear, and necessary to hear. All the while, my goal is ALWAYS to do so in a safe way that feels supportive, empathic, and non-judgmental.
14 Years Experience
In-Person Near Saint Charles, MD
Online in Saint Charles, MD
Middle Eastern therapists in Saint Charles, MD Statistics
Middle Eastern therapists in Saint Charles, MD average 16 years of experience and charge around $234 per session. 100% offer online sessions. The most commonly treated issues are Anxiety or Fears (88%), Depression (76%), and Loss or Grief (63%).
Average years in practice
16 Years Experience
Average cost per session
$234
Accept insurance
32%
Offer sliding scale
49%
Gender ID
| 60% |
Female |
|
| 32% |
Male |
|
| 6% |
Non-Binary |
|
| 2% |
Gender Fluid |
|
Session Type
| 54% |
In Person and Online |
|
| 46% |
Online Only |
|
Top Specialties
| 88% | Anxiety or Fears |
| 76% | Depression |
| 63% | Loss or Grief |
| 63% | Trauma and PTSD |
| 54% | ADHD |
| 54% | Relationship and Marriage Counseling |
| 54% | Self Esteem |
Ages Served
| 100% | Adult |
| 83% | Young Adult |
| 71% | Senior |
| 39% | Teen |
| 24% | Children |
Client Focus
| 100% | Middle Eastern |
| 93% | Black / African American |
| 90% | Women |
| 88% | Hispanic / Latino |
| 88% | LGBTQ+ |