Native American therapists in Moorhead, MN
Browse Native American therapists in Moorhead, Minnesota. Compare credentials, specialties and therapeutic approach. Contact a therapist to learn more.

Serving Native American
Sharon Davern MSED, LMFT
Marriage and Family Therapist, Licensed in Minnesota, Tennessee
I am licensed in both Minnesota and Tennessee as a Marriage and Family Therapist. Currently I am providing televideo therapy to citizens of both states. I have over 40 years in the human service field. I have worked extensively with individuals, couples, families and groups. My specialities are PTSD, relationship problems, depression, anxiety, OCD, co-dependency, domestic violence,, chemical abuse and dependency.
37 Years Experience
Online in Moorhead, MN (Online Only)
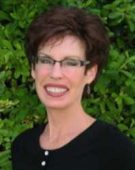
Serving Native American
Kathleen Cramer, Ph.D.
Psychologist, Ph.D., PSYPACT member
My approach to therapy is eclectic and tailored to each patient’s individual needs with a strong emphasis on techniques from Cognitive Behavior Therapy. Therapy is conducted with patients struggling with various diagnoses such as anxiety, depression, bipolar disorder, schizoaffective disorder, physical limitations, etc. However, you do not need to have a “problem” or “disorder” to benefit from individual therapy. For example, psychologists can help people make important decisions and learn how to manage their lives more productively. Just as you visit physicians for preventive care, you can meet with a psychologist to address issues before they become problematic. This proactive approach encourages the development of psychological health. People are in good psychological health when they make good decisions, manage stress well, communicate effectively, have healthy relationships, and take good care of themselves emotionally and physically.
22 Years Experience
Online in Moorhead, MN (Online Only)

Serving Native American
Karambir Khalsa | Khalsa Psychology PLLC
Psychologist, (AZ PSY-005603), Non-Licensed Clinician (CO NLC.0107000)
I create a safe place for you to process your concerns and heal. Sessions are conversational in nature. I want to hear your concerns in your own words and I will reflect back what I am hearing so you can confirm or correct. Our conversations help me to know which techniques are relevant and applicable to your concerns.
3 Years Experience
Online in Moorhead, MN
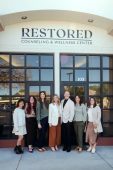
Serving Native American
Restored Counseling & Wellness Center, PLLC
Marriage and Family Therapist, LMFT, LPC, NMD
Your brain, body, and relationships were designed to work for you — not against you. At Restored, we believe healing is about more than symptom management. It's about reclaiming your sense of self, rebuilding connection, and growing into the life and purpose you were meant for. Our therapists and naturopathic doctors share a deep commitment to treating the whole person — because sustainable restoration requires addressing mind, body, spirit, and relationships together.
14 Years Experience
Online in Moorhead, MN

Serving Native American
Natalie Campbell
Psychologist, PsyD; LLC
I've been a Clinical Psychologist since 1997 and love this work! It's a privilege to trudge the road to happy destiny with individuals who aspire to
29 Years Experience
Online in Moorhead, MN (Online Only)
Native American therapists in Moorhead, MN Statistics
Native American therapists in Moorhead, MN average 17 years of experience and charge around $247 per session. 100% offer online sessions. The most commonly treated issues are Anxiety or Fears (90%), Depression (79%), and Loss or Grief (77%).
Average years in practice
17 Years Experience
Average cost per session
$247
Accept insurance
33%
Offer sliding scale
44%
Gender ID
| 64% |
Female |
|
| 30% |
Male |
|
| 4% |
Non-Binary |
|
| 2% |
Gender Fluid |
|
Session Type
| 62% |
Online Only |
|
| 38% |
In Person and Online |
|
Top Specialties
| 90% | Anxiety or Fears |
| 79% | Depression |
| 77% | Loss or Grief |
| 67% | Trauma and PTSD |
| 62% | Self Esteem |
| 56% | Stress |
| 54% | Divorce |
Ages Served
| 100% | Adult |
| 87% | Young Adult |
| 77% | Senior |
| 31% | Teen |
| 13% | Children |
Client Focus
| 100% | Native American |
| 95% | Women |
| 90% | Hispanic / Latino |
| 79% | Black / African American |
| 79% | Persons with Disabilities |