Native American therapists in Rochester, NH
Browse Native American therapists in Rochester, New Hampshire. Compare credentials, specialties and therapeutic approach. Contact a therapist to learn more.
View nearby cities
Serving Native American
New England Pastoral Institute
Pastoral Counselor/Therapist, NEPI
The New England Pastoral Institute is a not-for-profit, multi-disciplinary, pastoral psychotherapy and education center committed to caring for the emotional, intellectual, relational, physical, and spiritual needs of persons, families, and organizations through counseling, education, training, and consultation.
43 Years Experience
In-Person Near Rochester, NH
Online in Rochester, NH

Serving Native American
Dr. Allison Williams
Psychologist, Psy.D.
I specialize in helping those who are anxious and overwhelmed learn to recognize and honor their needs - it may mean: giving yourself permission to slow down, scale back, set healthy boundaries, go after what you truly want, and be yourself (authentically and unapologetically). As your partner on this journey, I’ll help you muster your strength, foster your self-acceptance, and feel more at ease.
If you’ve always cast aside your own needs to give everyone and everything your all, I want to help you finally get what you deserve: better relationships, self-care, and greater life satisfaction.
10 Years Experience
Online in Rochester, NH (Online Only)
Serving Native American
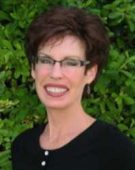
Kathleen Cramer, Ph.D.
Psychologist, Ph.D., PSYPACT member
My approach to therapy is eclectic and tailored to each patient’s individual needs with a strong emphasis on techniques from Cognitive Behavior Therapy. Therapy is conducted with patients struggling with various diagnoses such as anxiety, depression, bipolar disorder, schizoaffective disorder, physical limitations, etc. However, you do not need to have a “problem” or “disorder” to benefit from individual therapy. For example, psychologists can help people make important decisions and learn how to manage their lives more productively. Just as you visit physicians for preventive care, you can meet with a psychologist to address issues before they become problematic. This proactive approach encourages the development of psychological health. People are in good psychological health when they make good decisions, manage stress well, communicate effectively, have healthy relationships, and take good care of themselves emotionally and physically.
22 Years Experience
Online in Rochester, NH (Online Only)

Serving Native American
Dr. Fatuma Dzilala
Psychologist, PsyD
You spend so much time showing up for everyone else, but when was the last time you truly showed up for yourself? Whether you're struggling with anxiety, navigating difficult relationships, feeling stuck in life, or simply wanting to understand yourself better, you deserve a space to focus on you. I'm a licensed clinical psychologist passionate about helping women feel more confident, emotionally grounded, and empowered to create meaningful change. My approach is warm, collaborative, and culturally responsive, with room for both honest conversations and laughter along the way. You don't have to figure everything out on your own. Let's connect!
8 Years Experience
Online in Rochester, NH (Online Only)

Serving Native American
Teona Amble
Psychologist, Ph.D., LP
Are you feeling overwhelmed? Are you unsure of how to make changes in your life? Do you want to to take back control of your health? Now is the time to focus on your wellness. I am here to create a wellness plan with you to improve your mood and stress management as well as help you cope with life changes and stress. I take pride in helping my clients become their own therapists, more confident in managing life’s demands. I look forward to helping build your toolbox to improve your quality of life. I treat my clients with respect and empathy, valuing connection in healing.
15 Years Experience
Online in Rochester, NH (Online Only)
Native American therapists in Rochester, NH Statistics
Native American therapists in Rochester, NH average 18 years of experience and charge around $247 per session. 100% offer online sessions. The most commonly treated issues are Anxiety or Fears (89%), Depression (76%), and Loss or Grief (74%).
Average years in practice
18 Years Experience
Average cost per session
$247
Accept insurance
34%
Offer sliding scale
42%
Gender ID
| 64% |
Female |
|
| 32% |
Male |
|
| 2% |
Gender Fluid |
|
| 2% |
Non-Binary |
|
Session Type
| 61% |
Online Only |
|
| 39% |
In Person and Online |
|
Top Specialties
| 89% | Anxiety or Fears |
| 76% | Depression |
| 74% | Loss or Grief |
| 63% | Trauma and PTSD |
| 61% | Self Esteem |
| 53% | Stress |
| 50% | Divorce |
Ages Served
| 100% | Adult |
| 89% | Young Adult |
| 76% | Senior |
| 29% | Teen |
| 13% | Children |
Client Focus
| 100% | Native American |
| 95% | Women |
| 87% | Hispanic / Latino |
| 82% | Black / African American |
| 79% | Asian |