Asian therapists in Mullica Hill, NJ
Browse Asian therapists in Mullica Hill, New Jersey. Compare credentials, specialties and therapeutic approach. Contact a therapist to learn more.

Serving Asian
Dr. Alisha Desai
Psychologist, PhD
I am a firm believer that we are all capable of change. At the same time, I understand how difficult and scary change can be - even if it's what we want most. My goal is to help others build the confidence to see themselves fully and move through life based on their own inner compass.
My approach is collaborative, practical, and grounded in evidence-based practices. I aim to create a space where you can be honest about what you’re experiencing, without judgment, while developing concrete tools to navigate challenges, build resilience, and live a life that feels more meaningful and aligned with your values.
9 Years Experience
Online in Mullica Hill, NJ (Online Only)

Serving Asian
Yaffa Dyckman
Licensed Clinical Social Worker, LCSW
Does the past still haunt you? Are you stuck thinking about a difficult experience, a relationship, a memory? Past Traumatic experiences and painful relationships can steal the joy out of life. So can negative self-talk. I can help you live more in the present and look positively towards the future. I bring over 15 years of clinical experience into my virtual and in person practices. I integrate both EMDR and psychodynamic therapy, two therapy approaches that I am certified in. I work with STAIR-NST as well, an approach that integrates both cognitive behavioral therapy and attachment theory. Don’t wait any longer to start feeling better. Let’s begin this journey together.
16 Years Experience
Online in Mullica Hill, NJ

Serving Asian
Roland Achtau
Licensed Clinical Social Worker, LCSW, LCADC, ICGC-1, CSAT Candidate
Due to the sensitive nature of addiction, it is important to seek help from someone who understands. Having had my own personal recovery experience, I understand and relate to the challenges of maintaining one's recovery. I give specialized attention to each client I serve by treating him or her holistically and offering him or her an umbrella of complimentary services. Recovery is about treating the person, not just the addiction.
11 Years Experience
Online in Mullica Hill, NJ

Serving Asian
Dr. Samira Paul Olive Tree Psychology Clinic LLC
Psychologist, PsyD
At Olive Tree Psychology Clinic LLC, we believe that healing requires entering a space where you feel truly seen, understood, and respected. We honor your presence and we meet you exactly where you are.
7 Years Experience
Online in Mullica Hill, NJ (Online Only)
Serving Asian
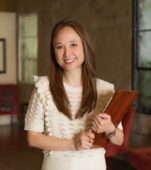
Anna Yu Lee
Life Coach, PhD, MPH, MA
Dr. Anna Yu Lee is the founder of Concierge Mental Health & Associates (CMHA), a collaborative consultation practice, not a psychotherapy service. CMHA specializes in supporting clinicians, researchers, and educators, primarily high-achieving Asian women aged 18-40 through customized evaluations and feedback measures, individualized support plans, and curated referrals to a network of highly skilled mental health providers and evidence-based services including individual and couples therapy, neuropsychological assessments, and creative/educational workshops.
4 Years Experience
Online in Mullica Hill, NJ
Asian therapists in Mullica Hill, NJ Statistics
Asian therapists in Mullica Hill, NJ average 15 years of experience and charge around $226 per session. 100% offer online sessions. The most commonly treated issues are Anxiety or Fears (80%), Depression (77%), and Loss or Grief (62%).
Average years in practice
15 Years Experience
Average cost per session
$226
Accept insurance
34%
Offer sliding scale
42%
Gender ID
| 63% |
Female |
|
| 31% |
Male |
|
| 5% |
Non-Binary |
|
| 1% |
Gender Fluid |
|
Session Type
| 50% |
In Person and Online |
|
| 50% |
Online Only |
|
Top Specialties
| 80% | Anxiety or Fears |
| 77% | Depression |
| 62% | Loss or Grief |
| 62% | Trauma and PTSD |
| 59% | Self Esteem |
| 54% | Stress |
| 46% | Social Anxiety |
Ages Served
| 100% | Adult |
| 85% | Young Adult |
| 73% | Senior |
| 45% | Teen |
| 24% | Children |
Client Focus
| 100% | Asian |
| 91% | Women |
| 76% | Hispanic / Latino |
| 76% | Men |
| 74% | Black / African American |