Divorce therapists in Greensboro, NC
Browse Divorce therapists in Greensboro, North Carolina. Compare credentials, specialties and therapeutic approach. Contact a therapist to learn more.
Divorce
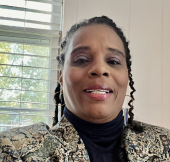
Dr. Cathy E. Pickett
Licensed Professional Counselor, LCMHC, LCA, CCTP, NCC
Divorce can bring grief, anger, uncertainty, loneliness, and major life changes. I provide a supportive space to process the emotional impact of divorce while helping you develop healthy coping skills, rebuild your confidence, adjust to your new circumstances, and move forward with greater clarity and emotional strength.
12 Years Experience
In-Person Near Greensboro, NC
Online in Greensboro, NC

Divorce
Insight Therapeutic and Wellness Solutions, PLLC
Licensed Mental Health Counselor, LCMHCS, NCC, ACS
We have a licensed marriage and family therapist available to help you and your loved one(s) with any relationship struggles.
12 Years Experience
In-Person Near Greensboro, NC
Online in Greensboro, NC

Divorce
Dr. Cierra Listermann
Psychologist, Ph.D., HSP-P
Divorce can bring feelings of grief, rejection, uncertainty, anger, and loss of identity, especially when the relationship involved emotional harm, betrayal, conflict, or past trauma. I help clients process the emotional impact of divorce, understand how their experiences have shaped their beliefs about themselves and relationships, rebuild confidence, and move forward with a stronger sense of self.
9 Years Experience
Online in Greensboro, NC (Online Only)

Divorce
Seven Hills Psychology
Psychologist, Psychologist
We offer counseling for individuals or couples going through a separation or divorce.
18 Years Experience
Online in Greensboro, NC

Divorce
Amy Look
Psychologist, PhD, LP
Are you feeling overwhelmed by the emotional weight of divorce, unsure how to navigate such a major life transition? Together, we’ll use evidence-based strategies to help you process your emotions, regain stability, and build a foundation for your next chapter. With the right support, it’s possible to move forward with greater clarity and confidence. If you’re ready to take that first step, feel free to call or send a message.
7 Years Experience
Online in Greensboro, NC (Online Only)
Greensboro is home to multiple universities — including the University of North Carolina at Greensboro, North Carolina A&T State University, and Guilford College — creating significant student mental health demand and a historically grounded HBCU community with deep connections to the civil rights movement. The city's textile and furniture manufacturing heritage has given way to healthcare, education, and distribution as primary economic drivers, and therapists frequently address occupational transitions and the identity challenges of a post-industrial workforce. Cone Health provides major institutional mental health resources, alongside a private practice community serving the Fisher Park and Irving Park neighborhoods. Greensboro's significant Vietnamese, Korean, and Latino communities drive growing demand for culturally affirming and multilingual therapists.
Divorce therapists in Greensboro, NC Statistics
Divorce therapists in Greensboro, NC average 19 years of experience and charge around $200 per session. 100% offer online sessions. The top treatment approaches are Cognitive Behavioral Therapy (CBT) (78%), Person-Centered Therapy (Rogerian) (41%), and Acceptance & Commitment Therapy (ACT) (36%).
Average years in practice
19 Years Experience
Average cost per session
$200
Accept insurance
41%
Offer sliding scale
39%
Gender ID
| 62% |
Female |
|
| 34% |
Male |
|
| 3% |
Non-Binary |
|
| 1% |
Gender Fluid |
|
Session Type
| 61% |
In Person and Online |
|
| 39% |
Online Only |
|
Top Treatment Approaches
| 78% | Cognitive Behavioral Therapy (CBT) |
| 41% | Person-Centered Therapy (Rogerian) |
| 36% | Acceptance & Commitment Therapy (ACT) |
| 36% | Psychodynamic Therapy |
| 34% | Family Systems Therapy |
| 33% | Solution-Focused Brief Therapy (SFBT) |
| 32% | Behavioral Therapy |
Ages Served
| 98% | Adult |
| 81% | Young Adult |
| 59% | Senior |
| 52% | Teen |
| 24% | Children |
Client Focus
| 63% | Women |
| 51% | Men |
| 46% | LGBTQ+ |
| 38% | Military / Veterans |
| 30% | Christian |