Women therapists in Ashtabula, OH
Browse Women therapists in Ashtabula, Ohio. Compare credentials, specialties and therapeutic approach. Contact a therapist to learn more.

Serving Women
Maria T. Alonso, Ph.D.
Psychologist
I believe that psychotherapy offers you an opportunity to examine your life story and in the process, gain new perspective and insight to re-write it and create a new narrative. While you may come to therapy with a problem to explore and address, I will also help you identify your personal character strengths and ways to nurture them, in order to support your personal growth and achieve your goals. I am a warm and supportive psychotherapist with an eclectic therapuetic approach, using both Western evidence based interventions as well as Eastern treatment approaches to help promote your healing and growth. I believe that collaboration, openness, curiosity and humor are key ingredients to a successful therapeutic experience. Psychotherapy is an adventure and I look forward to walking by your side on your chosen journey.
29 Years Experience
Online in Ashtabula, OH
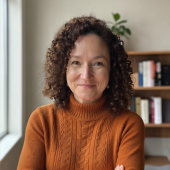
Serving Women
Maria Elena Lara, Ph.D. LLC
Psychologist, Ph.D.
As a licensed Ph.D. clinical psychologist for over twenty-five years, I have helped hundreds of clients to understand not only why they feel debilitated and burdened but how to overcome these challenges and achieve greater balance in their lives.
Together, we can make changes that will last, and give you greater hope for the future, and a healthy, more complete sense of well-being.
26 Years Experience
Online in Ashtabula, OH

Serving Women
Jennifer Jones Cameron
Psychologist, Ph.D.
Welcome! I’m Dr. Jennifer Cameron, a licensed psychologist dedicated to helping you understand and overcome the challenges you face. Whether you’re dealing with mental health issues, medical conditions, or life transitions, I’m here to offer support with a compassionate, evidence-based approach. Together, we’ll work towards achieving your goals and improving your quality of life.
16 Years Experience
Online in Ashtabula, OH

Serving Women
Kelsey Beil, Amplify Counseling Services, LLC
Licensed Clinical Social Worker, LISW-S
If you are looking for a therapist to work alongside of you, as you heal from trauma, address areas you are unhappy with, or to simply grow into healthier and happier habits, I would love to work with you! I am a laid back and communicative therapist who is open, empathetic, and a strong ally. I bring experience that allows clients to understand and heal from the past while learning practical skills for the present and future.
14 Years Experience
Online in Ashtabula, OH (Online Only)

Serving Women
Catherine Bitney
Psychologist, PhD, Licensed Psychologist
I have a passion for helping clients reduce anxiety, stress, confusion, sadness, and pain - so that they can live more fulfilling, authentic, and happy lives. Many of my clients have stated that coming to therapy has helped to catapult them out of their stagnation - enabling them to reach their full potential. For clients who have had difficulty finding a therapist who can understand their complex and intersecting identities, I can be a breath of fresh air. I work with folks ages 15 and up.
15 Years Experience
Online in Ashtabula, OH (Online Only)
Women therapists in Ashtabula, OH Statistics
Women therapists in Ashtabula, OH average 16 years of experience and charge around $214 per session. 100% offer online sessions. The most commonly treated issues are Anxiety or Fears (81%), Depression (66%), and Stress (60%).
Average years in practice
16 Years Experience
Average cost per session
$214
Accept insurance
37%
Offer sliding scale
33%
Gender ID
| 76% |
Female |
|
| 20% |
Male |
|
| 3% |
Non-Binary |
|
| 1% |
Gender Fluid |
|
Session Type
| 51% |
Online Only |
|
| 49% |
In Person and Online |
|
Top Specialties
| 81% | Anxiety or Fears |
| 66% | Depression |
| 60% | Stress |
| 57% | Trauma and PTSD |
| 51% | Loss or Grief |
| 50% | Self Esteem |
| 49% | Women's Issues |
Ages Served
| 99% | Adult |
| 75% | Young Adult |
| 50% | Senior |
| 38% | Teen |
| 17% | Children |
Client Focus
| 100% | Women |
| 58% | LGBTQ+ |
| 55% | Men |
| 34% | Military / Veterans |
| 33% | Black / African American |