Therapists in Fort Mill, SC
Browse therapists in Fort Mill, South Carolina. Compare credentials, specialties and therapeutic approach. Contact a therapist to learn more.
View nearby cities

Julius “Skip “ Meyer
Marriage and Family Therapist, LMFT, MA
Over 30 of providing individual,couples & individual therapy to treat multiple including anx,stress, depression, infidelity, divorce, blended family, addictions; taught at universities, providing clinical training and supervision; utilizing an effective humanistic approach to provide options, increasing coping skills & stategies to improve quality of life.
In-Person Near Fort Mill, SC
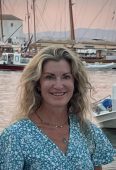
Robin Wellington
Counselor/Therapist, LPC-A, RYT-500, CTP, CSTFP
Do you appear to be managing life well on the outside, yet inside feel anxious, overwhelmed, or disconnected from yourself? Many of the people I work with are thoughtful, capable individuals who understand their patterns yet still feel stuck in them. I offer a warm, compassionate space grounded in trauma-focused, mind-body approaches where we explore what’s happening in your mind, body, and nervous system so you can experience real change—not just insight, but a deeper sense of calm, clarity, and connection.
5 Years Experience
Online in Fort Mill, SC (Online Only)
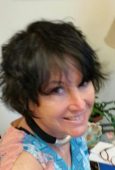
Dr. Dorothy McCoy
Licensed Professional Counselor, licensed in NC , and SC LPC , Certified Integrative Counselor
Today you are one step closer to a new you where you feel empowered and on a positive path to growth and well-being.
As a solution-focused therapist, my goal is to help you uncover your true potential and lead a life that is worth celebrating. While we can't change difficult situations of the past, we can work together to better understand and resolve challenges in your life. By applying complementary therapy approaches and techniques, we will unearth long-standing behavior patterns or negative perceptions that may be holding you back from experiencing a more fulfilling and meaningful life.
If you're looking for extra support and guidance through a challenging situation or you're just ready to move in a new direction in your life, I look forward to working with you to achieve your goals.
New Certification: CERTIFIED CLINICAL ANXIETY TREATMENT PROFESSIONAL and Certified Integrative Counselor
25 Years Experience
In-Person Near Fort Mill, SC
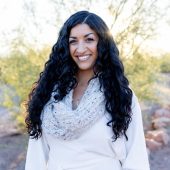
Dr. Amanda Malak
Psychologist, Clinical Psychologist
I believe people can build the lives they want to live by aligning themselves with their values, which may shift with the various seasons of life.
12 Years Experience
Online in Fort Mill, SC

Dr. Samantha Morris
Psychologist, PsyD
I am a clinical and sports psychologist who has been in practice for over 10 years. I have experience working with elite level athletes with a variety of presenting concerns, from performance-based difficulties, to anxiety, to other mental health struggles. I am passionate about making therapy feel comfortable and accessible to all and my clients find me to be down to earth and easy to talk to. Whether you are a high school athlete trying to start healthy habits early or a collegiate/professional athlete struggling with the pressure and demands, I am here to help.
11 Years Experience
Online in Fort Mill, SC (Online Only)
Fort Mill, SC therapists Statistics
Therapists in Fort Mill, SC average 16 years of experience and charge around $206 per session. 100% offer online sessions. The most commonly treated issues are Anxiety or Fears (81%), Depression (67%), and Stress (54%).
Average years in practice
16 Years Experience
Average cost per session
$206
Accept insurance
41%
Offer sliding scale
30%
Gender ID
| 67% |
Female |
|
| 30% |
Male |
|
| 2% |
Non-Binary |
|
| 1% |
Gender Fluid |
|
Session Type
| 52% |
In Person and Online |
|
| 48% |
Online Only |
|
Top Specialties
| 81% | Anxiety or Fears |
| 67% | Depression |
| 54% | Stress |
| 52% | Trauma and PTSD |
| 45% | Self Esteem |
| 42% | Loss or Grief |
| 38% | Social Anxiety |
Ages Served
| 99% | Adult |
| 68% | Young Adult |
| 47% | Senior |
| 36% | Teen |
| 15% | Children |
Client Focus
| 50% | Women |
| 34% | LGBTQ+ |
| 33% | Men |
| 22% | Military / Veterans |
| 20% | Black / African American |