Chronic Pain therapists in North Augusta, SC
Browse Chronic Pain therapists in North Augusta, South Carolina. Compare credentials, specialties and therapeutic approach. Contact a therapist to learn more.

Chronic Pain
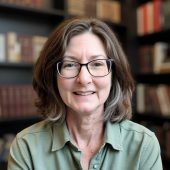
Chelsie Ciminelli
Licensed Clinical Social Worker, Holistic Health Practitioner
I support individuals navigating the emotional and psychological challenges of living with chronic illness, chronic pain, fatigue, or ongoing health concerns. Chronic illness can profoundly affect your sense of identity, relationships, independence, and connection with your body, often bringing grief, fear, frustration, anxiety, or a sense of losing the life you once imagined. In addition to supporting the emotional impact of illness, I offer integrative mind-body and somatic modalities that explore the deeper emotional patterns, unresolved experiences, and underlying factors that may be contributing to or interacting with your physical symptoms and overall well-being. Together, we work to cultivate greater nervous-system regulation, self-compassion, body awareness, and trust while honoring the complexity of your individual healing journey.
7 Years Experience
Online in North Augusta, SC
Chronic Pain
Celeste Nettles
Counselor/Therapist, MS, MBS, LCMHC
I strive to approach each session in a nonjudgmental, hopeful, and strength-based manner. I am here to help you improve the coping skills you need to face life's challenges.
21 Years Experience
Online in North Augusta, SC

Chronic Pain
Dr. Justin D'Arienzo
Psychologist, Psy.D., ABPP
We provide CBT pain management services and psychological testing for spine stimulators.
Online in North Augusta, SC

Chronic Pain
Dr. Amy Schullery
Psychologist, Psy.D.
I support clients with chronic physical issues and adjustment to any limitations.
19 Years Experience
Online in North Augusta, SC

Chronic Pain
Dyani Saxby
Psychologist, Ph.D., ABPP, DBSM
There is a difference between living with chronic pain and suffering with it. Suffering includes depression, unresolved grief, anxiety, isolation, and withdrawal. Chronic pain can cause these feelings because we grieve what we used to be able to do and feel that pain robs us of living a full life. Sometimes we feel like we lose ourselves entirely. When we are in a depressed or anxious mood state for a long period of time, we actually end up experiencing worse pain (and often worse sleep), which results in a vicious cycle that can feel impossible to break. The good news is that I have helped hundreds of patients improve how they respond to their pain and also lower their overall pain levels. They began to accept what they cannot control and also learn how to have more control over their pain levels through techniques such as physical pacing, relaxation, and clinical hypnosis. With board certifications in clinical health psychology, behavioral sleep medicine, and extensive training in clinical hypnosis, I can teach you skills to break the cycle of chronic pain and suffering.
14 Years Experience
Online in North Augusta, SC
Chronic Pain therapists in North Augusta, SC Statistics
Chronic Pain therapists in North Augusta, SC average 15 years of experience and charge around $212 per session. 100% offer online sessions. The top treatment approaches are Cognitive Behavioral Therapy (CBT) (83%), Acceptance & Commitment Therapy (ACT) (47%), and Behavioral Therapy (41%).
Average years in practice
15 Years Experience
Average cost per session
$212
Accept insurance
46%
Offer sliding scale
38%
Gender ID
| 67% |
Female |
|
| 28% |
Male |
|
| 3% |
Non-Binary |
|
| 2% |
Gender Fluid |
|
Session Type
| 53% |
In Person and Online |
|
| 47% |
Online Only |
|
Top Treatment Approaches
| 83% | Cognitive Behavioral Therapy (CBT) |
| 47% | Acceptance & Commitment Therapy (ACT) |
| 41% | Behavioral Therapy |
| 36% | Person-Centered Therapy (Rogerian) |
| 32% | Solution-Focused Brief Therapy (SFBT) |
| 28% | Emotionally Focused Therapy (EFT) |
| 28% | Psychodynamic Therapy |
Ages Served
| 99% | Adult |
| 64% | Senior |
| 64% | Young Adult |
| 42% | Teen |
| 22% | Children |
Client Focus
| 59% | Women |
| 42% | Men |
| 40% | Persons with Disabilities |
| 37% | Military / Veterans |
| 35% | LGBTQ+ |