Chronic Pain therapists in Rapid City, South Dakota
Browse Chronic Pain therapists in Rapid City, South Dakota. Compare credentials, specialties and therapeutic approach. Contact a therapist to learn more.
View nearby cities

Chronic Pain
Kimberly Kiselica
Psychologist, PhD, ABPP
Chronic pain or illness can become all-encompassing. I offer therapy targeted toward managing chronic pain/illness to work toward getting your life back.
7 Years Experience
Online in Rapid City, (Online Only)

Chronic Pain
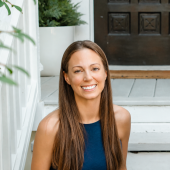
Dr. Daisy Vélez
Psychologist, PsyD, DipACLM, PMH-C
Living with chronic pain or illness means facing challenges that often go unseen by others—but deeply impact every part of your life. Whether you're navigating daily symptoms, medical uncertainty, shifting roles, or emotional exhaustion, I offer a space that’s compassionate, collaborative, and grounded in evidence-based care. Using mindfulness, Acceptance and Commitment Therapy (ACT), and mind-body strategies, we’ll work together to help you move through pain and illness without being defined by them—so you can reconnect with meaning, resilience, and the life you want to live.
9 Years Experience
Online in Rapid City,
Chronic Pain
Mallory Lamb
Psychologist, Psy.D.
I have a specialty background in Health Psychology, which is where medical and mental health meet. Therapy can assist with adjustment and coping strategies related to acute or chronic pain and illness.
13 Years Experience
Online in Rapid City, (Online Only)

Chronic Pain
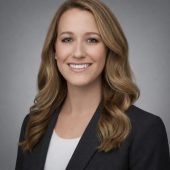
Ann Aspnes
Psychologist, PhD, ABPP
In treating chronic pain, I integrate Cognitive Behavioral Therapy for Chronic Pain (CBT-CP) and Acceptance and Commitment Therapy (ACT) to help you reclaim your quality of life. Together, we focus on concrete pain-coping strategies, including relaxation techniques and mindfulness, to quiet the physical stress response and alter how your brain processes pain signals. We also target distressing thought patterns like catastrophizing—which can amplify physical suffering—replacing them with grounded, empowering perspectives. Using ACT, our ultimate goal shifts from fighting the pain to building a rich, value-driven life alongside it, ensuring that chronic pain no longer dictates your choices, goals, or daily well-being.
18 Years Experience
Online in Rapid City,
Chronic Pain
Heinig Health and Wellness Counseling
Psychologist, Ph.D. Clinical Psychology, M.S. Health Psychology, M.A. Clinical Psychology, PSYPACT Providers
We utilize a biopsychosocial approach to chronic pain and chronic illness treatment that recognizes the complex interaction between physical, emotional, psychological, and social factors that influence pain. Through evidence-based psychotherapy, clients learn strategies to manage the emotional impact of chronic pain, reduce stress, improve coping skills, and enhance overall functioning and quality of life. Treatment is individualized to address each person's unique experience, helping them build resilience, increase self-efficacy, and engage more fully in meaningful daily activities.
7 Years Experience
Online in Rapid City, (Online Only)
Chronic Pain therapists in Rapid City, South Dakota Statistics
Chronic Pain therapists in Rapid City, South Dakota average 16 years of experience and charge around $220 per session. 100% offer online sessions. The top treatment approaches are Cognitive Behavioral Therapy (CBT) (83%), Acceptance & Commitment Therapy (ACT) (49%), and Behavioral Therapy (43%).
Average years in practice
16 Years Experience
Average cost per session
$220
Accept insurance
36%
Offer sliding scale
36%
Gender ID
| 67% |
Female |
|
| 32% |
Male |
|
| 1% |
Non-Binary |
|
Session Type
| 54% |
In Person and Online |
|
| 46% |
Online Only |
|
Top Treatment Approaches
| 83% | Cognitive Behavioral Therapy (CBT) |
| 49% | Acceptance & Commitment Therapy (ACT) |
| 43% | Behavioral Therapy |
| 33% | Person-Centered Therapy (Rogerian) |
| 29% | Emotionally Focused Therapy (EFT) |
| 29% | Family Systems Therapy |
| 28% | Biopsychosocial Therapy |
Ages Served
| 99% | Adult |
| 68% | Senior |
| 61% | Young Adult |
| 45% | Teen |
| 23% | Children |
Client Focus
| 57% | Women |
| 46% | Men |
| 42% | Military / Veterans |
| 41% | Persons with Disabilities |
| 38% | LGBTQ+ |