Therapists that treat Seniors in Rapid City, South Dakota
Browse therapists that treat Seniors in Rapid City, South Dakota. Compare credentials, specialties and therapeutic approach. Contact a therapist to learn more.
View nearby cities
Senior
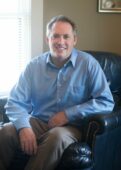
Dr. Brian Weir
Psychologist, PsyD
Are you looking for a therapist who is engaging, warm, understanding, experienced and very knowledgeable? If so, I'm your therapist. I have helped others like you improve their relationships, overcome anxiety, depression and anger. Even if you have lost hope, together we can build self-confidence, strengthen resilience, and find motivation to overcome the obstacles. Whether you come for individual, or for couples therapy, my clients are often surprised what can be overcome and how much better things can be.
Most people spend weeks or even months contemplating getting professional help. During that time, most continue to do what hasn't worked and things can deteriorate fast. When you contact me today, you are opening the door to relieving distressful symptoms and living a better life.
23 Years Experience
Online in Rapid City,
Senior
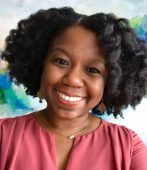
Dr. Felicia Jackson
Psychologist, PhD
You may be tired of overthinking, second-guessing yourself, or feeling like everyday challenges take more energy than they should. Maybe you know what you want to change but struggle to figure out how to get there. Therapy can help you understand what's keeping you stuck, build practical skills, and start approaching life with greater confidence and flexibility. My goal is to create a space where you feel understood, supported, and empowered to make meaningful changes that last.
7 Years Experience
Online in Rapid City, (Online Only)
Senior
Chuck Gray, Ph.D.
Psychologist
Since 1987 Chuck Gray, Ph.D. has specialized in marriage counseling, premarital counseling, and dating issues. His goal is to gently assist you in bringing out the best in yourselves, each other, and your relationship.
39 Years Experience
Online in Rapid City,
Senior
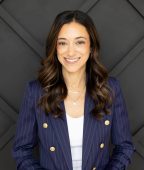
Allison Lobel
Psychologist, Psy.D.
I believe therapy should be a supportive and collaborative space where people of all ages feel understood and valued. I provide outpatient psychotherapy for children, teens, and adults, drawing from psychodynamic, CBT, and family systems approaches to support meaningful growth and healing. My goal is to help clients navigate challenges, strengthen relationships, and foster resilience in ways that feel authentic and lasting.
19 Years Experience
Online in Rapid City,

Senior
Dr. Allison Williams
Psychologist, Psy.D.
I specialize in helping those who are anxious and overwhelmed learn to recognize and honor their needs - it may mean: giving yourself permission to slow down, scale back, set healthy boundaries, go after what you truly want, and be yourself (authentically and unapologetically). As your partner on this journey, I’ll help you muster your strength, foster your self-acceptance, and feel more at ease.
If you’ve always cast aside your own needs to give everyone and everything your all, I want to help you finally get what you deserve: better relationships, self-care, and greater life satisfaction.
10 Years Experience
Online in Rapid City, (Online Only)
Senior therapists in Rapid City, South Dakota Statistics
Senior therapists in Rapid City, South Dakota average 18 years of experience and charge around $218 per session. 100% offer online sessions. The most commonly treated issues are Anxiety or Fears (83%), Depression (70%), and Stress (58%).
Average years in practice
18 Years Experience
Average cost per session
$218
Accept insurance
36%
Offer sliding scale
31%
Gender ID
| 62% |
Female |
|
| 35% |
Male |
|
| 2% |
Non-Binary |
|
| 1% |
Gender Fluid |
|
Session Type
| 50% |
In Person and Online |
|
| 50% |
Online Only |
|
Top Specialties
| 83% | Anxiety or Fears |
| 70% | Depression |
| 58% | Stress |
| 53% | Loss or Grief |
| 50% | Trauma and PTSD |
| 45% | Self Esteem |
| 39% | Relationship and Marriage Counseling |
Ages Served
| 100% | Adult |
| 100% | Senior |
| 76% | Young Adult |
| 39% | Teen |
| 15% | Children |
Client Focus
| 50% | Women |
| 39% | LGBTQ+ |
| 39% | Men |
| 29% | Military / Veterans |
| 27% | Black / African American |