Person-Centered Therapy (Rogerian) therapists in Maryville, TN
Browse Person-Centered Therapy (Rogerian) therapists in Maryville, Tennessee. Compare credentials, specialties and therapeutic approach. Contact a therapist to learn more.

Person-Centered
Karen Hartfield, MA, LMHC, Fearless Heart Counseling
Licensed Professional Counselor, Certified Sandplay Therapist with STA
It is my desire to provide a place of safety and acceptance in which people may explore their feelings, process current and past experiences, and come to a better understanding of themselves. It is my goal to provide adolescents and adults with whatever assistance I can in their journeys to recognize and claim their own inner strength.
12 Years Experience
Online in Maryville, TN (Online Only)

Person-Centered
Simply Being Therapy
Counselor/Therapist
At Simply Being our therapists join with you to help facilitate healing and connection. As a holistic therapeutic practice, we help you to recognize and accept your psychological and neurophysiological responses to stressors and all forms of trauma, in order for you to build capacity to hold and resolve your pain.
Our therapists are experts at treating trauma, anxiety, depression, chronic stress and more. We incorporate knowledge of the brain and body, using both “talk” therapy and somatic approaches. Our therapists are trained in Somatic Experiencing, EMDR, parts-work, depth psychology, mindfulness practices and other forms of proven trauma treatments.
7 Years Experience
Online in Maryville, TN

Person-Centered
Kristen W. Green
Psychologist, PhD, ABPP
I am a Board Certified Clinical Child & Adolescent Psychologist. I specializing in therapy and psychological testing. I work successfully with: developmental delays, behavioral problems, mood disorders, ADHD, adjustment issues (divorce, death, illness, general stress), anxiety/OCD, and autism spectrum conditions. I tend toward a cognitive-behavioral approach in a developmental framework. I also utilize biofeedback, mindfulness, DBT, and psychodynamic techniques. I work closely with parents/families as needed. My clients are most successful in therapy when their parents/families are committed to being involved and support the therapeutic process. I approach my work with the goal of fully understanding each client and their unique circumstances.
21 Years Experience
Online in Maryville, TN

Person-Centered
Patricia McGuire
Counselor/Therapist, LPC-MHSP, NCC
As a licensed professional counselor, I provide individual therapy services for adults who experience anxiety, depression, grief, eating disorders, body image concerns, chronic stress, and life transitions. I believe the power of relationships is the lifeforce in our stories - we're not meant to be alone. I'm honored to journey with you as a fellow human and therapist in exploring your thoughts, emotions, and experiences to help you get unstuck and flourishing.
11 Years Experience
Online in Maryville, TN
Person-Centered
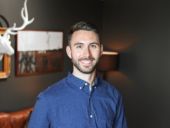
Christian Bumpous
Marriage and Family Therapist, LMFT, LPC, CDWF
“We get better in connection” is one of the mantras I live by. And what better way to make that happen than in therapy? We all know what it’s like to feel unwell and in the struggle.
17 Years Experience
Online in Maryville, TN
Person-Centered Therapy (Rogerian) therapists in Maryville, TN Statistics
Person-Centered Therapy (Rogerian) therapists in Maryville, TN average 16 years of experience and charge around $206 per session. 100% offer online sessions. The most commonly treated issues are Anxiety or Fears (87%), Depression (79%), and Stress (73%).
Average years in practice
16 Years Experience
Average cost per session
$206
Accept insurance
37%
Offer sliding scale
39%
Gender ID
| 69% |
Female |
|
| 28% |
Male |
|
| 2% |
Non-Binary |
|
| 1% |
Gender Fluid |
|
Session Type
| 60% |
In Person and Online |
|
| 40% |
Online Only |
|
Top Specialties
| 87% | Anxiety or Fears |
| 79% | Depression |
| 73% | Stress |
| 64% | Loss or Grief |
| 62% | Self Esteem |
| 55% | Trauma and PTSD |
| 50% | Women's Issues |
Ages Served
| 99% | Adult |
| 77% | Young Adult |
| 50% | Senior |
| 43% | Teen |
| 18% | Children |
Client Focus
| 57% | Women |
| 39% | LGBTQ+ |
| 37% | Men |
| 22% | Military / Veterans |
| 21% | Hispanic / Latino |