Native American therapists in Mount Juliet, TN
Browse Native American therapists in Mount Juliet, Tennessee. Compare credentials, specialties and therapeutic approach. Contact a therapist to learn more.
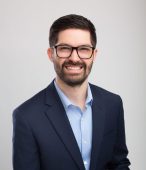
Serving Native American
Dr. Joe Rustum
Psychologist, PsyD, License Psychologist
I work with high achievers, professionals, executives, and driven individuals who look capable on the outside but feel overwhelmed, self-critical, or stuck in constant overthinking. You may be managing career pressure, anxiety, burnout, perfectionism, procrastination, relationship stress, or difficulty setting boundaries. Even when things look successful from the outside, it can feel exhausting to keep pushing while privately second-guessing yourself.
My approach is practical, direct, and focused on helping you make meaningful changes in your day-to-day life. We will work on understanding the patterns that keep you stuck, building confidence in your decisions, improving boundaries, managing stress more effectively, and creating a healthier relationship with work, achievement, and responsibility. The goal is not just insight, but real progress.
9 Years Experience
In-Person Near Mount Juliet, TN
Online in Mount Juliet, TN

Serving Native American
Sharon Davern MSED, LMFT
Marriage and Family Therapist, Licensed in Minnesota, Tennessee
I am licensed in both Minnesota and Tennessee as a Marriage and Family Therapist. Currently I am providing televideo therapy to citizens of both states. I have over 40 years in the human service field. I have worked extensively with individuals, couples, families and groups. My specialities are PTSD, relationship problems, depression, anxiety, OCD, co-dependency, domestic violence,, chemical abuse and dependency.
37 Years Experience
Online in Mount Juliet, TN (Online Only)

Serving Native American
MindOverHealing Therapies
Hypnotherapist, CHt
My practice of MindOverHealing Therapies is dedicated to supporting and helping individuals achieve holistic mind-body-spirit healing so they can break through barriers and be empowered to experience life's possibilities. At this time, I offer online therapy sessions where clients can receive sessions in the comfort of their homes.
3 Years Experience
Online in Mount Juliet, TN (Online Only)
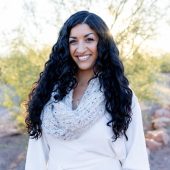
Serving Native American
Dr. Amanda Malak
Psychologist, Clinical Psychologist
I believe people can build the lives they want to live by aligning themselves with their values, which may shift with the various seasons of life.
12 Years Experience
Online in Mount Juliet, TN

Serving Native American
Dr. Sophia Aguirre
Psychologist, Ph.D., CGP, F-AGPA
I am a Licensed Psychologist and founder of the Aguirre Center of Inclusive Psychotherapy, a group practiced dedicated to providing culturally-affirming psychotherapy. I have a passion for working with folks who hold marginalized identities including Latinx, BIPOC, LGBTQ+ and relationship-structure minorities.
I have over a decade of experience of providing psychotherapy to individuals, couples, and groups with a wide-range of concerns and struggles, but a common focus in my clinical work is helping individuals establishing healthier, more authentic relationships with themselves and with others.
17 Years Experience
Online in Mount Juliet, TN
Native American therapists in Mount Juliet, TN Statistics
Native American therapists in Mount Juliet, TN average 18 years of experience and charge around $244 per session. 100% offer online sessions. The most commonly treated issues are Anxiety or Fears (88%), Depression (78%), and Loss or Grief (73%).
Average years in practice
18 Years Experience
Average cost per session
$244
Accept insurance
33%
Offer sliding scale
43%
Gender ID
| 67% |
Female |
|
| 29% |
Male |
|
| 2% |
Gender Fluid |
|
| 2% |
Non-Binary |
|
Session Type
| 60% |
Online Only |
|
| 40% |
In Person and Online |
|
Top Specialties
| 88% | Anxiety or Fears |
| 78% | Depression |
| 73% | Loss or Grief |
| 65% | Trauma and PTSD |
| 58% | Self Esteem |
| 50% | Divorce |
| 50% | Stress |
Ages Served
| 100% | Adult |
| 88% | Young Adult |
| 75% | Senior |
| 33% | Teen |
| 15% | Children |
Client Focus
| 100% | Native American |
| 95% | Women |
| 90% | Hispanic / Latino |
| 83% | Black / African American |
| 78% | LGBTQ+ |