LGBTQ+ therapists in Palestine, TX
Browse LGBTQ+ therapists in Palestine, Texas. Compare credentials, specialties and therapeutic approach. Contact a therapist to learn more.
View nearby cities

Serving LGBTQ+
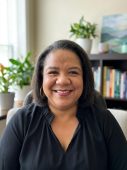
Dr. Monica Dyer
Psychiatric Nurse Practitioner, DNP, MPH, FNP, PMHNP
I strive to understand your story—not just your symptoms—and to partner with you in creating a plan that aligns with your needs, values, and goals. To heal, we need to feel safe, heard, and empowered. You don’t have to navigate this alone. I’m here to walk with you, support you, and help you rediscover hope, strength, and stability on your path forward.
3 Years Experience
Online in Palestine, TX (Online Only)
Serving LGBTQ+
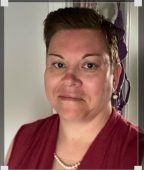
Cerise Edmonds
Licensed Professional Counselor, MS, LPC-A, NCC
Cerise is a dedicated and compassionate counselor who provides a supportive, non-judgmental space for individuals to navigate life’s challenges. She earned her master’s degree in Clinical Mental Health Counseling from the University of Texas at San Antonio in 2021.
4 Years Experience
Online in Palestine, TX
Serving LGBTQ+
Shawna Damiani
Licensed Professional Counselor, LPC
Hi, I'm Shawna. I'm really glad you're here — and I know that finding the right therapist can feel like a lot. My hope is that by the time you finish reading this, you'll have a sense of who I am and whether we might be a good fit.
I work with adults who are carrying things that feel heavy — whether that's the weight of past trauma, the complexity of relationships that keep hitting the same walls, or the experience of moving through a world that wasn't quite designed for the way your brain works. I specialize in trauma and PTSD, relationship challenges, and supporting adults with ADHD and autism who are often figuring out a lot about themselves for the first time.
A lot of my clients come to me feeling like something is wrong with them. My job — and honestly, my passion — is helping people see that they've been responding to hard things in the most human ways possible. Healing isn't about fixing yourself. It's about understanding yourself.
My approach is collaborative and down-to-earth. I'm not going to sit silently and nod — I show up as a real person in the room with you. Therapy with me tends to feel like an honest, sometimes even humorous conversation, grounded in real tools and genuine care.
If any of this resonates, I'd love to hear from you. Reaching out is the hardest part — and you've already started.
8 Years Experience
Online in Palestine, TX (Online Only)
Serving LGBTQ+
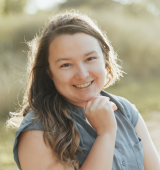
Lydia Anthony | Rejoice in the Rain Counseling
Counselor/Therapist, LPC #85822
Do you feel powerless against the whirlpool of rapid changes? Do you feel drowned by the downpour of fear, worry, & anxiety? Is it hard to see beyond the dark clouds of depression? Perhaps you feel swept away by the waves of hurt, regret, & guilt. Or caught up in a cyclone of self-doubt & insecurity.
Let me be your companion through the rain into a new chapter of your life!—Offering online therapy in Texas and Vermont for anxiety and panic attacks, depression, grief and trauma, and health-related stressors.
6 Years Experience
Online in Palestine, TX (Online Only)

Serving LGBTQ+
Greta Carlson, Psy.D., ABPP
Psychologist, Licensed Clinical Psychologist
Welcome! I'm a clinical psychologist with nearly a decade of clinical experience working with children, adolescents, and adults of all ages. I see children, adolescents, and young adults aged 5 and up with depression, chronic PTSD and dissociation, anxiety, OCD, and ADHD. My clients present with a range of concerns, including anxiety, ruminative thoughts, shame feelings, and perfectionism. Having had extensive experience in both psychodynamic psychotherapy and Trauma Focused-CBT, I take an integrative approach when working with clients-I collaborate with you and your child to tailor your goals and address needs for treatment.
While we would tailor treatment to further draw out and address your goals, I work to help you get to know yourself-to name and regulate a range of feelings, identify negative beliefs about yourself, others, or the world, and find healthier ways to cope with strong feelings. I also consider how your past history is relevant to your present relationships.
The decision to seek therapy is such a courageous one. I think, oftentimes, we can tell ourselves that we can "think through" or "solve problems" entirely on our own-it's so difficult to reach out for support! I work at a pace that feels manageable for you or your child, focusing on creating a warm and collaborative alliance for therapy and assessment.
7 Years Experience
Online in Palestine, TX (Online Only)
LGBTQ+ therapists in Palestine, TX Statistics
LGBTQ+ therapists in Palestine, TX average 14 years of experience and charge around $193 per session. 100% offer online sessions. The most commonly treated issues are Anxiety or Fears (80%), Depression (67%), and Trauma and PTSD (61%).
Average years in practice
14 Years Experience
Average cost per session
$193
Accept insurance
48%
Offer sliding scale
42%
Gender ID
| 63% |
Female |
|
| 30% |
Male |
|
| 4% |
Non-Binary |
|
| 3% |
Gender Fluid |
|
Session Type
| 56% |
In Person and Online |
|
| 44% |
Online Only |
|
Top Specialties
| 80% | Anxiety or Fears |
| 67% | Depression |
| 61% | Trauma and PTSD |
| 56% | LGBTQ+ Issues |
| 56% | Stress |
| 54% | Loss or Grief |
| 48% | Self Esteem |
Ages Served
| 99% | Adult |
| 76% | Young Adult |
| 56% | Senior |
| 44% | Teen |
| 20% | Children |
Client Focus
| 100% | LGBTQ+ |
| 81% | Women |
| 58% | Men |
| 45% | Black / African American |
| 44% | Hispanic / Latino |