Native American therapists in West Odessa, TX
Browse Native American therapists in West Odessa, Texas. Compare credentials, specialties and therapeutic approach. Contact a therapist to learn more.
View nearby cities
Serving Native American
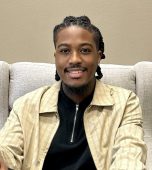
Micah Gultery LPC, Mental Health Therapist
Licensed Professional Counselor, LPC
Micah Gultery, LPC, has been in the mental health community and gained expertise in various areas working with individuals, couples (traditional and non-traditional), and families who are navigating through life adjustments, adversities, stressors, trauma, anxiety, or depression. He believes therapy is a powerful tool to restore an person's well-being. Micah brings a welcoming atmosphere for the client to feel empowered through their obstacles.
2 Years Experience
Online in West Odessa, TX

Serving Native American
Dua Health
Counselor/Therapist
Dua Health is a Texas mental health practice offering therapy and psychiatry online statewide and in person in Austin and The Woodlands near Houston. Our licensed therapists help adults, couples, and college students with anxiety, depression, stress, relationship issues, grief, burnout, and ADHD. We match every client with a therapist who understands their culture, identity, and goals, with affirming care for people of color, LGBTQ+ clients, and Muslim clients. Most major insurance plans accepted. Contact us today to find the right therapist for you.
1 Years Experience
Online in West Odessa, TX

Serving Native American
Philadelphia Couples Therapy
Psychologist, PsyD
We are a collective of couples psychologists united by the shared conviction that relationships deserve more emotional care and community support than our culture provides. Building and sustaining a loving partnership isn’t meant to happen in isolation — it takes a village. In today’s world, we ask more of our partners than ever before. Our partners are our confidants, our co-parents, our lovers, our best friends, and the witnesses to both our strength and our vulnerability. This profound closeness is one of life’s greatest gifts, yet it can also create immense pressure. At PCT, we strive to be that village — a steady emotional anchor for couples navigating the highs and lows of connection.
Every kind of couple is welcome here: those deeply in love, those in conflict, those recovering from betrayal, and those unsure of how to move forward. Together, we help partners rediscover what first drew them together while uncovering new ways to grow intimacy and trust. Our work isn’t about perfection — it’s about helping two people feel seen, understood, and supported as they evolve together.
Sometimes, relationships reach a crossroads. The clinicians at PCT are skilled at holding space for both partners’ perspectives, guiding them through painful or uncertain transitions toward clarity and peace. That might mean learning to co-parent respectfully, parting ways with compassion, or exploring whether staying together is truly right. Even after a breakup, we help couples find a way to relate from steadier ground — because healing, too, is a form of love. We remain beside you for as long as you need, until the storm calms and a new balance emerges.
We also offer individual therapy for those seeking personal growth, clarity, or support. Whether you’re navigating life transitions, managing stress, or simply looking to better understand yourself, our psychologists provide a safe, compassionate space to explore your goals and challenges.
23 Years Experience
Online in West Odessa, TX

Serving Native American
Tamara C. Taylor
Licensed Professional Counselor, LPC, NCC, MCHC, ASDCS
As a Licensed Professional Counselor with board certification, Master Certified Health Coach and Autism Spectrum Disorder Clinical Specialist with 19+ years of experience, I want to hear your story. Why? Because it is your story and you deserve to tell it. Your story could be about happiness, love, hurt, anger, stress, anxiety, depression, life transitions and grief just to name a few. Sometimes all anyone wants to do is tell someone caring and compassionate their perspective regarding their story. As a therapist, I believe in giving everyone I meet a clean, unbiased slate. No judgment here. I will use a holistic (mind and body), open-minded and solution-focused approach in assisting anyone in telling their story, processing the events and moving forward with their life goals. I will support and at times coach you on practical ways to build tools to help you navigate this thing we call life.
19 Years Experience
Online in West Odessa, TX (Online Only)

Serving Native American
Dr. Monica Dyer
Psychiatric Nurse Practitioner, DNP, MPH, FNP, PMHNP
I strive to understand your story—not just your symptoms—and to partner with you in creating a plan that aligns with your needs, values, and goals. To heal, we need to feel safe, heard, and empowered. You don’t have to navigate this alone. I’m here to walk with you, support you, and help you rediscover hope, strength, and stability on your path forward.
3 Years Experience
Online in West Odessa, TX (Online Only)
Native American therapists in West Odessa, TX Statistics
Native American therapists in West Odessa, TX average 15 years of experience and charge around $197 per session. 100% offer online sessions. The most commonly treated issues are Anxiety or Fears (89%), Depression (83%), and Trauma and PTSD (70%).
Average years in practice
15 Years Experience
Average cost per session
$197
Accept insurance
52%
Offer sliding scale
48%
Gender ID
| 66% |
Female |
|
| 32% |
Male |
|
| 1% |
Gender Fluid |
|
| 1% |
Non-Binary |
|
Session Type
| 57% |
Online Only |
|
| 43% |
In Person and Online |
|
Top Specialties
| 89% | Anxiety or Fears |
| 83% | Depression |
| 70% | Trauma and PTSD |
| 65% | Loss or Grief |
| 57% | Self Esteem |
| 54% | Stress |
| 49% | Divorce |
Ages Served
| 100% | Adult |
| 87% | Young Adult |
| 78% | Senior |
| 48% | Teen |
| 22% | Children |
Client Focus
| 100% | Native American |
| 90% | Women |
| 86% | Hispanic / Latino |
| 84% | Black / African American |
| 78% | Men |