Elderly Persons Disorders therapists in Millcreek, UT
Browse Elderly Persons Disorders therapists in Millcreek, Utah. Compare credentials, specialties and therapeutic approach. Contact a therapist to learn more.

Elderly Issues
Dr. Weston Donaldson
Psychologist, PhD, ABPP
Getting older doesn't always look the way you thought it would. Maybe your body is changing, your social world is smaller, or you're taking on caregiving responsibilities you never anticipated. Maybe you're wondering where you fit now, or whether there's still room for something new. For LGBTQ+ adults, aging can bring up questions about community, chosen family, independence, and who will be there when you need support. You don't have to pretend these changes are easy, or accept that your best years are behind you. Together, we can figure out what matters to you now, and what you want the next chapter to look like.
12 Years Experience
Online in Millcreek, UT (Online Only)

Elderly Issues
Dr. Jeff J. Rocker
Licensed Mental Health Counselor, PH.D, NCC, LMHC, LCPC, LPC
Rocker Health has experienced and competent staff to deal with these issues.
15 Years Experience
Online in Millcreek, UT

Elderly Issues
Dr. Amy Schullery
Psychologist, Psy.D.
I work with older clients on issues around aging, retirement, loss and other adjustments at this time of life.
19 Years Experience
Online in Millcreek, UT
Elderly Issues
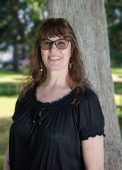
Lisa Calderwood / New Dawn Counseling, LLC
Licensed Clinical Social Worker, LCSW, LICSW
I have a lot of experience helping elderly coming to terms with their life, retirement and empty nest issues. I work with the client and the family to help the process of aging be less scary.
26 Years Experience
Online in Millcreek, UT (Online Only)
Elderly Issues
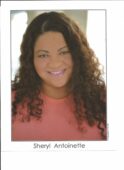
Dr. Sheryl Ferguson
Psychologist, (Psy.D.)
I can help with elderly phase of life issues. During our collaborative experience together, I will provide an empathic and caring space to help you move through your struggles, so you can live your best life. Together we will find ways towards a path of feeling better, leaning new coping skills to reconnect with your internal self.
23 Years Experience
Online in Millcreek, UT (Online Only)
Elderly Persons Disorders therapists in Millcreek, UT Statistics
Elderly Persons Disorders therapists in Millcreek, UT average 19 years of experience and charge around $212 per session. 100% offer online sessions. The top treatment approaches are Cognitive Behavioral Therapy (CBT) (74%), Solution-Focused Brief Therapy (SFBT) (53%), and Behavioral Therapy (47%).
Average years in practice
19 Years Experience
Average cost per session
$212
Accept insurance
58%
Offer sliding scale
32%
Gender ID
| 65% |
Female |
|
| 35% |
Male |
|
Session Type
| 53% |
In Person and Online |
|
| 47% |
Online Only |
|
Top Treatment Approaches
| 74% | Cognitive Behavioral Therapy (CBT) |
| 53% | Solution-Focused Brief Therapy (SFBT) |
| 47% | Behavioral Therapy |
| 47% | Eclectic Therapy |
| 37% | Acceptance & Commitment Therapy (ACT) |
| 37% | Existential / Humanistic Therapy |
| 32% | Mindfulness-Based Cognitive Therapy (MBCT) |
Ages Served
| 100% | Adult |
| 95% | Senior |
| 63% | Young Adult |
| 47% | Teen |
| 21% | Children |
Client Focus
| 58% | Women |
| 53% | LGBTQ+ |
| 53% | Men |
| 42% | Christian |
| 42% | Persons with Disabilities |