Male therapists in Rutland, VT
Browse Male therapists in Rutland, Vermont. Compare credentials, specialties and therapeutic approach. Contact a therapist to learn more.

Male
Andrew D. Sapp
Psychologist, PhD
With over two decades of experience working in diverse therapeutic environments—ranging from outpatient clinics to psychiatric hospitals, adventure programs, residential treatment facilities, schools, juvenile corrections, and a military hospital—I bring a wide-ranging perspective to problem-solving and overcoming life's obstacles. As the Founder & President of two award-winning mental health centers with a staff 150, I've gained a holistic and interdisciplinary approach to care.
20 Years Experience
Online in Rutland, VT (Online Only)
Male
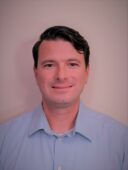
Richard Scott, Ph.D.
Psychologist, Ph.D.
Life can be challenging, and sometimes we find ourselves far from where we want to be or struggling to feel the happiness we deserve. Therapy provides a valuable opportunity to reflect, gain clarity, and work toward the life you envision. It’s truly a privilege to help my clients navigate their struggles and create healthier, more fulfilling lives. If you're ready to take that step, I’d be honored to support you on your journey.
20 Years Experience
Online in Rutland, VT

Male
Edmund LaBarbara
Psychologist, PsyD
As a clinical psychologist extensively trained in treating Obsessive-Compulsive Disorder at Harvard Medical School/McLean Hospital’s Institute (OCDI), I specialize in helping adults break free from overwhelming cycles of anxiety, avoidance, and compulsions.
From our very first sessions, we will thoroughly map out your specific challenges and build a individualized, actionable roadmap using Exposure and Response Prevention (ERP), CBT, and ACT. By utilizing secure teletherapy, we can do live, real-world exposures directly where your triggers occur—leading to a significant reduction in symptoms and lasting improvements in your daily well-being.
I am deeply passionate about providing culturally responsive, affirmative care. I strive to build a collaborative, secure space that honors individuals from all diverse sociocultural identities and backgrounds.
8 Years Experience
Online in Rutland, VT (Online Only)
Male
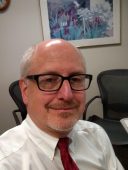
David B. Shaw, Ph.D.
Psychologist, Ph.D.
Experience counts! I have forty years experience as a Licensed Clinical Psychologist. I have held positions in major hospitals and clinical psychology training programs. I have also been on the faculty of two leading medical schools.
40 Years Experience
Online in Rutland, VT (Online Only)
Male
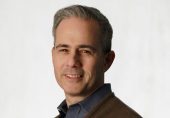
Richard (Rick) Brodsky
Psychologist, PsyD, MA
Are you looking for an effective and experienced therapist? I have over 20 years of experience working with adults to address challenges that inevitably disrupt our lives, giving us an opportunity to reconsider our values while exploring and implementing new solutions aligned with those values. Life can be joyful at times, yet life can also bring anxiety, depression, grief and trauma. As a psychologist, I help adults 18-50+ years old navigate these difficult moments. Reach out to me to schedule a free consultation to see if we are a good fit.
24 Years Experience
Online in Rutland, VT (Online Only)
Male therapists in Rutland, VT Statistics
Male therapists in Rutland, VT average 17 years of experience and charge around $216 per session. 100% offer online sessions. The most commonly treated issues are Anxiety or Fears (81%), Depression (65%), and Trauma and PTSD (50%).
Average years in practice
17 Years Experience
Average cost per session
$216
Accept insurance
39%
Offer sliding scale
32%
Gender ID
| 86% |
Male |
|
| 10% |
Female |
|
| 3% |
Non-Binary |
|
| 1% |
Gender Fluid |
|
Session Type
| 59% |
In Person and Online |
|
| 41% |
Online Only |
|
Top Specialties
| 81% | Anxiety or Fears |
| 65% | Depression |
| 50% | Trauma and PTSD |
| 49% | Stress |
| 44% | Relationship and Marriage Counseling |
| 44% | Social Anxiety |
| 42% | Self Esteem |
Ages Served
| 100% | Adult |
| 64% | Young Adult |
| 54% | Senior |
| 38% | Teen |
| 20% | Children |
Client Focus
| 47% | Men |
| 36% | LGBTQ+ |
| 32% | Women |
| 22% | Military / Veterans |
| 18% | Persons with Disabilities |