Native American therapists in Nogales, Arizona AZ
We are proud to feature top rated Native American therapists in Nogales. We encourage you to review each profile to find your best match.
Serving Native American
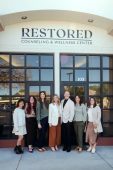
Restored Counseling & Wellness Center, PLLC
Marriage and Family Therapist, LMFT, LPC, NMD
Your brain, body, and relationships were designed to work for you — not against you. At Restored, we believe healing is about more than symptom management. It's about reclaiming your sense of self, rebuilding connection, and growing into the life and purpose you were meant for. Our therapists and naturopathic doctors share a deep commitment to treating the whole person — because sustainable restoration requires addressing mind, body, spirit, and relationships together.
14 Years Experience
Online in Nogales, AZ Arizona

Serving Native American
Urim Recovery, LLC
Therapist, Certified Trauma Therapist, LCSW
My approach to healing is client-centered through an attachment-based perspective to help clients attain inner calm and a sense of control. I offer supportive counseling with a keen eye for pinpointing your self-defeating patterns, strengths and solutions. What's unique about my approach is my emphasis on in-between session support and activity that empowers individuals to implement what they learn in sessions in practical ways that address their real life stuck points and triggers.
The aim is that you grow in resiliency and confidence to attain welcomed changes in your life. You are wired for healing and connection, and my job is to help you experience this. Key characteristics of my style include being genuine and direct with an emphasis on helping clients find purpose and emotional stability.
12 Years Experience
Online in Nogales, AZ Arizona

Serving Native American
Melissa Drinkman, Pathways To Connection
Licensed Clinical Social Worker, DBH, LCSW
Our practice is about helping people with connections, whether that be connecting with a partner, friend, spirit, the greater community or with self. We believe that it is in connection that we find wellness and healing.
14 Years Experience
Online in Nogales, AZ Arizona (Online Only)

Serving Native American
Nancy Hayes-Gary, Psy.D.
Psychologist, Licensed Psychologist, MD , Psy.D.
I have been a psychologist in trauma work for many years, thus I can tailor my approach to meet your needs. Different ages and developmental stages throughout the life span require differing approaches. People generally wait to start therapy until their symptoms are really bothersome. I am currently accepting new patients, with no waiting list.
33 Years Experience
Online in Nogales, AZ Arizona (Online Only)
Serving Native American
Dr. Indra Gonzalez
Psychologist, PsyD
I prioritize establishing a safe and genuine therapeutic relationship with each patient. I strive to create a space where they can feel seen, safe, and empowered. I take a collaborative and compassionate stance with patients. Within our work together, we will highlight diversity and cultural factors, personal values, resiliency, and strengths. I integrate trauma-informed and culturally responsive approaches alongside evidence-based modalities to address trauma, dissociation, anxiety, and depression.
8 Years Experience
Online in Nogales, AZ Arizona (Online Only)
Native American therapists in Nogales, Arizona Statistics
Native American therapists in Nogales, Arizona average 16 years of experience and charge around $221 per session. 100% offer online sessions. The most commonly treated issues are Anxiety or Fears (85%), Depression (72%), and Loss or Grief (67%).
Average years in practice
16 Years Experience
Average cost per session
$221
Accept insurance
31%
Offer sliding scale
54%
Gender ID
| 59% |
Female |
|
| 33% |
Male |
|
| 6% |
Non-Binary |
|
| 2% |
Gender Fluid |
|
Session Type
| 59% |
Online Only |
|
| 41% |
In Person and Online |
|
Top Specialties
| 85% | Anxiety or Fears |
| 72% | Depression |
| 67% | Loss or Grief |
| 59% | Trauma and PTSD |
| 56% | Self Esteem |
| 54% | Stress |
| 49% | Divorce |
Ages Served
| 95% | Adult |
| 74% | Young Adult |
| 69% | Senior |
| 38% | Teen |
| 18% | Children |
Client Focus
| 100% | Native American |
| 95% | Women |
| 85% | Hispanic / Latino |
| 82% | Black / African American |
| 79% | Persons with Disabilities |