Non-Binary therapists in Show Low, AZ
Browse Non-Binary therapists in Show Low, Arizona. Compare credentials, specialties and therapeutic approach. Contact a therapist to learn more.
Non-Binary
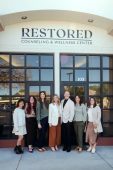
Restored Counseling & Wellness Center, PLLC
Marriage and Family Therapist, LMFT, LPC, NMD
Your brain, body, and relationships were designed to work for you — not against you. At Restored, we believe healing is about more than symptom management. It's about reclaiming your sense of self, rebuilding connection, and growing into the life and purpose you were meant for. Our therapists and naturopathic doctors share a deep commitment to treating the whole person — because sustainable restoration requires addressing mind, body, spirit, and relationships together.
14 Years Experience
Online in Show Low, AZ
Non-Binary
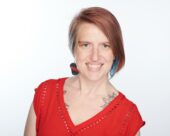
Bold Expressions Therapy
Psychologist, Psy.D.
As a member of the LGBTQIA+ community, a trauma survivor, and someone with a chronic pain disorder; I approach the work that I do from a place of empathy and personal understanding. I have an intense passion for understanding personal identity and the way race, culture, class, and sexuality come together to form what we believe about ourselves and what we feel we can accomplish in our lives. Anxiety and trauma can live in our bodies - together we will create a relationship that fosters dynamic and lasting growth, tapping into undiscovered reserves of resiliency that will help navigate the past and prepare for a more hopeful future.
6 Years Experience
Online in Show Low, AZ
Non-Binary
Resonate Counseling Services
Therapist, LCPC, LCSW, LGPC, LMSW
Are you stuck at a point where you can’t manage your depression or anxiety?
Going through a life transition that is wearing you out and don't know where to turn? Perhaps you or a loved one has expressed concern that you may have a problem with substance abuse?
If so, you've come to the right place!
Anxiety, Depression, and Life Transition are very common reasons to seek counseling. At Resonate Counseling Services, our goal is to help you become the best version of yourself you can be while working through your personal challenges. We value and incorporate compassion, authenticity, creativity and collaboration into the services we provide and look forward to helping you take the next step towards a better life.
14 Years Experience
Online in Show Low, AZ

Non-Binary
Catherine Bitney
Psychologist, PhD, Licensed Psychologist
I have a passion for helping clients reduce anxiety, stress, confusion, sadness, and pain - so that they can live more fulfilling, authentic, and happy lives. Many of my clients have stated that coming to therapy has helped to catapult them out of their stagnation - enabling them to reach their full potential. For clients who have had difficulty finding a therapist who can understand their complex and intersecting identities, I can be a breath of fresh air. I work with folks ages 15 and up.
15 Years Experience
Online in Show Low, AZ (Online Only)
Non-Binary
NeuroSpark Health
Psychologist
NeuroSpark Health specializes in providing ND-affirming autism and ADHD assessment as well as therapy, coaching, accommodations, and other support services to neurodivergent adults.
15 Years Experience
Online in Show Low, AZ (Online Only)
Non-Binary therapists in Show Low, AZ Statistics
Non-Binary therapists in Show Low, AZ average 10 years of experience and charge around $190 per session. 100% offer online sessions. The most commonly treated issues are Anxiety or Fears (82%), Depression (82%), and LGBTQ+ Issues (82%).
Average years in practice
10 Years Experience
Average cost per session
$190
Accept insurance
64%
Offer sliding scale
36%
Gender ID
| 38% |
Non-Binary |
|
| 31% |
Female |
|
| 21% |
Male |
|
| 10% |
Gender Fluid |
|
Session Type
| 73% |
Online Only |
|
| 27% |
In Person and Online |
|
Top Specialties
| 82% | Anxiety or Fears |
| 82% | Depression |
| 82% | LGBTQ+ Issues |
| 73% | ADHD |
| 73% | Trauma and PTSD |
| 64% | Social Anxiety |
| 64% | Stress |
Ages Served
| 91% | Adult |
| 82% | Young Adult |
| 55% | Teen |
| 45% | Senior |
| 36% | Children |
Client Focus
| 82% | LGBTQ+ |
| 82% | Women |
| 55% | Persons with Disabilities |
| 45% | Hispanic / Latino |
| 36% | Black / African American |