OCD therapists in Salinas, CA
Browse OCD therapists in Salinas, California. Compare credentials, specialties and therapeutic approach. Contact a therapist to learn more.

OCD
Sydney Egan
Drug and Alcohol Counselor, AMFT, APCC
I have experience working with OCD and helping people better understand their behaviors and emotions. With a DBT background I will help you build skills to help ground yourself and feel more in control of your life.
2 Years Experience
Online in Salinas, CA (Online Only)

OCD
Marina Edelman | TrueMe Counseling
Marriage and Family Therapist, LMFT
We support clients struggling with obsessive thoughts and compulsive behaviors using evidence-based approaches. Treatment focuses on reducing anxiety cycles and restoring daily functioning.
20 Years Experience
Online in Salinas, CA

OCD
PBA Psychology Group, Inc.
Psychologist, Clinical and Forensic Psychology
We offer OCD specific treatment aimed at reducing obsessive and compulsive behaviors, rituals etc.
30 Years Experience
Online in Salinas, CA
OCD
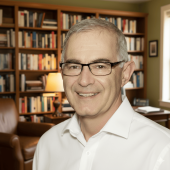
Dennis Sapire
Psychologist, JD PhD
I am CBT trained and have helped many clients overcome OCD using evidence-based approaches.
24 Years Experience
Online in Salinas, CA

OCD
Gail Kirk Poust
Marriage and Family Therapist, LMFT
OCD is a bully that takes your values hostage. It finds what you care about most (your loved ones' safety, your goodness, your faith, your relationship) and turns it into unwanted thoughts you can't shake and rituals you can't skip: checking, washing, confessing, mentally reviewing, asking for reassurance one more time. The relief never lasts, and the loop keeps tightening. Here's what I want you to know: intrusive thoughts are not intentions, and being horrified by a thought is proof of your values, not evidence against them. I treat OCD with ERP (Exposure and Response Prevention), the gold-standard approach. It is collaborative, paced, never sprung on you. I also treat postpartum OCD, where intrusive thoughts about your baby leave you terrified and silent. That, too, is treatable, and having the thought is not the same as being a danger. The thoughts have had the last word long enough.
12 Years Experience
Online in Salinas, CA (Online Only)
OCD therapists in Salinas, CA Statistics
OCD therapists in Salinas, CA average 18 years of experience and charge around $226 per session. 100% offer online sessions. The top treatment approaches are Cognitive Behavioral Therapy (CBT) (76%), Solution-Focused Brief Therapy (SFBT) (36%), and Acceptance & Commitment Therapy (ACT) (34%).
Average years in practice
18 Years Experience
Average cost per session
$226
Accept insurance
43%
Offer sliding scale
30%
Gender ID
| 55% |
Female |
|
| 38% |
Male |
|
| 4% |
Non-Binary |
|
| 3% |
Gender Fluid |
|
Session Type
| 59% |
In Person and Online |
|
| 41% |
Online Only |
|
Top Treatment Approaches
| 76% | Cognitive Behavioral Therapy (CBT) |
| 36% | Solution-Focused Brief Therapy (SFBT) |
| 34% | Acceptance & Commitment Therapy (ACT) |
| 34% | Emotionally Focused Therapy (EFT) |
| 33% | Behavioral Therapy |
| 33% | Dialectical Behavior Therapy (DBT) |
| 32% | Eye Movement Desensitization and Reprocessing (EMDR) |
Ages Served
| 99% | Adult |
| 62% | Young Adult |
| 57% | Senior |
| 47% | Teen |
| 24% | Children |
Client Focus
| 46% | Women |
| 43% | LGBTQ+ |
| 42% | Men |
| 36% | Military / Veterans |
| 32% | Black / African American |