Native American therapists in Avon, CO
Browse Native American therapists in Avon, Colorado. Compare credentials, specialties and therapeutic approach. Contact a therapist to learn more.

Serving Native American
Denver Mental Health Collective
Licensed Clinical Social Worker, LCSW
Denver Mental Health Collective is a group of therapists with a wide variety of specialties and experience. We value offering in person and virtual therapy to those from all walks of life. Whether you have been in therapy for years or seeking it for the first time, we can help you find a therapist who will be the right fit for your needs.
11 Years Experience
Online in Avon, CO
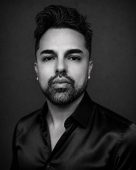
Serving Native American
Vincent Espinoza
Licensed Clinical Social Worker, LCSW
My therapy practice is focused on YOU, first and foremost! I believe we are all unique and a culmination of our values, desires, experiences and our untapped potential. My mission as a mental health clinician is to help my clients learn how to talk about sex in a healthy, unapologetic, sex-positive way and to confront and address past trauma so they can move into the present and enjoy a fulfilling life.
12 Years Experience
Online in Avon, CO (Online Only)

Serving Native American
Melaney Flaniken
Licensed Professional Counselor, LPC, B.S., Integrative Health Studies M.S., Clinical Mental Health Counseling
My counseling is rooted in trauma-informed care, existential exploration, and evidence-based practices like CBT and ERP. Whether you’re facing anxiety, navigating a life transition, or simply longing for more meaning and connection, we’ll work together to create a space where your voice matters and your goals guide the way.
You won’t get a one-size-fits-all approach here. Instead, you’ll be met exactly where you are—with compassion, curiosity, and a belief in your capacity to grow and heal.
If you're ready to explore your story, shift what’s no longer working, and step into a more empowered version of yourself, I invite you to reach out. Your healing starts with a single conversation—and I’m here when you’re ready.
3 Years Experience
Online in Avon, CO (Online Only)
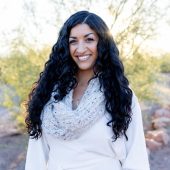
Serving Native American
Dr. Iziz Malak
Psychologist, Clinical Psychologist
I believe people can build the lives they want to live by aligning themselves with their values, which may shift with the various seasons of life.
12 Years Experience
Online in Avon, CO

Serving Native American
Tycee Belcastro
Marriage and Family Therapist, M.A., LMFT, CSTIP
Starting from your first session, we’ll dive into your growth journey together, picking up practical tools and making real progress toward what matters to you. Whether you’re craving deeper connections with yourself or others, a more vibrant sex life, or healing from trauma or betrayal, I’ve got your back. I’m a Licensed Marriage and Family Therapist and Certified Couples and Sex Therapy Informed Professional with over 20 years of experience—and I don’t just teach this stuff, I live it too. Each session, you’ll walk away with a clearer sense of who you are, what’s holding you back, and how to move forward with your partner(s) or on your own. I love sparking that creative spark in you to help you live your brightest, most authentic life.
21 Years Experience
Online in Avon, CO
Native American therapists in Avon, CO Statistics
Native American therapists in Avon, CO average 17 years of experience and charge around $215 per session. 100% offer online sessions. The most commonly treated issues are Anxiety or Fears (81%), Depression (69%), and Trauma and PTSD (63%).
Average years in practice
17 Years Experience
Average cost per session
$215
Accept insurance
37%
Offer sliding scale
39%
Gender ID
| 61% |
Female |
|
| 26% |
Male |
|
| 8% |
Non-Binary |
|
| 5% |
Gender Fluid |
|
Session Type
| 56% |
Online Only |
|
| 44% |
In Person and Online |
|
Top Specialties
| 81% | Anxiety or Fears |
| 69% | Depression |
| 63% | Trauma and PTSD |
| 61% | Loss or Grief |
| 56% | Self Esteem |
| 52% | Stress |
| 44% | Divorce |
Ages Served
| 100% | Adult |
| 85% | Young Adult |
| 78% | Senior |
| 39% | Teen |
| 11% | Children |
Client Focus
| 100% | Native American |
| 91% | Hispanic / Latino |
| 91% | Women |
| 81% | Black / African American |
| 81% | LGBTQ+ |