Multicultural therapists in Montville Center, CT
Browse Multicultural therapists in Montville Center, Connecticut. Compare credentials, specialties and therapeutic approach. Contact a therapist to learn more.
Multicultural
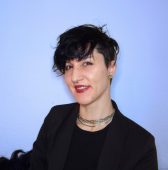
Molly Toomey
Licensed Clinical Social Worker, LCSW
To all those who don't fit neatly into society's norms of gender, sexuality, relationships, and cultures—this is a space for you! As a queer neurodivergent person and immigrant, I'm deeply passionate about connecting my communities to affirming, accessible mental health care. I've helped hundreds of people to get "un-stuck" from difficult pasts and repetitive cycles and to move toward clarity, connection, community, and a life they enjoy living. I'd love to help you on your own journey forward, with me by your side as your ally and co-conspirator.
9 Years Experience
Online in Montville Center, CT (Online Only)

Multicultural
Eagle Feather Psychotherapy
Licensed Clinical Social Worker, LCSW, LICSW
Natasha is Founder/Owner, of Eagle Feather Psychotherapy & has over 11 years of experience as a professional clinical therapist. She helps, individuals and couples function at their best, in their healing journey. Natasha supports individuals who seek positive change in their life, learn to become healthier & more empowered and her goal is to help patients thrive, and achieve balance.
Natasha provides treatment in a comfortable safe space and ensures individuals are respected.
Natasha supports people in their mental health journey by helping them address unwanted symptoms & personal life issues, including relationships, family, work, home & school. She is a creative, warm, supportive clinical therapist & her goal is to provide treatment with a culturally competent mental health treatment approach that is individualized.
12 Years Experience
Online in Montville Center, CT (Online Only)

Multicultural
Nancy Hayes-Gary, Psy.D.
Psychologist, Licensed Psychologist, MD , Psy.D.
I have been a psychologist in trauma work for many years, thus I can tailor my approach to meet your needs. Different ages and developmental stages throughout the life span require differing approaches. People generally wait to start therapy until their symptoms are really bothersome. I am currently accepting new patients, with no waiting list.
33 Years Experience
Online in Montville Center, CT (Online Only)

Multicultural
Dr. Amanda Malak
Psychologist, Clinical Psychologist
I believe people can build the lives they want to live by aligning themselves with their values, which may shift with the various seasons of life.
12 Years Experience
Online in Montville Center, CT

Multicultural
Maggie Reynolds
Licensed Professional Counselor, LCPC, EMDR Certified, NCC
With 15 years of experience as a Licensed Clinical Professional Counselor, I genuinely love being part of the moment when things start to shift, when you feel more grounded, more open, and more like yourself again. My goal is to create a space where you can show up as your whole self, and I’ll do the same. Many of my clients are thoughtful, capable people who have already done therapy and want something that helps them break through old patterns and grow in a new direction.
16 Years Experience
Online in Montville Center, CT
Multicultural Therapy therapists in Montville Center, CT Statistics
Multicultural Therapy therapists in Montville Center, CT average 14 years of experience and charge around $206 per session. 100% offer online sessions. The most commonly treated issues are Anxiety or Fears (82%), Depression (73%), and Stress (66%).
Average years in practice
14 Years Experience
Average cost per session
$206
Accept insurance
40%
Offer sliding scale
40%
Gender ID
| 67% |
Female |
|
| 25% |
Male |
|
| 6% |
Non-Binary |
|
| 2% |
Gender Fluid |
|
Session Type
| 51% |
In Person and Online |
|
| 49% |
Online Only |
|
Top Specialties
| 82% | Anxiety or Fears |
| 73% | Depression |
| 66% | Stress |
| 66% | Trauma and PTSD |
| 59% | Women's Issues |
| 53% | Self Esteem |
| 51% | ADHD |
Ages Served
| 99% | Adult |
| 74% | Young Adult |
| 42% | Senior |
| 37% | Teen |
| 21% | Children |
Client Focus
| 75% | Women |
| 62% | LGBTQ+ |
| 47% | Men |
| 41% | Hispanic / Latino |
| 40% | Black / African American |