Multicultural therapists in Kathleen, GA
Browse Multicultural therapists in Kathleen, Georgia. Compare credentials, specialties and therapeutic approach. Contact a therapist to learn more.

Multicultural
Dr. Fatuma Dzilala
Psychologist, PsyD
You spend so much time showing up for everyone else, but when was the last time you truly showed up for yourself? Whether you're struggling with anxiety, navigating difficult relationships, feeling stuck in life, or simply wanting to understand yourself better, you deserve a space to focus on you. I'm a licensed clinical psychologist passionate about helping women feel more confident, emotionally grounded, and empowered to create meaningful change. My approach is warm, collaborative, and culturally responsive, with room for both honest conversations and laughter along the way. You don't have to figure everything out on your own. Let's connect!
8 Years Experience
Online in Kathleen, GA (Online Only)

Multicultural
Unchained Brain LLC
Psychologist, PsyD
Unchained Brain is built on the belief that therapy should help you make sense of your experiences, not just cope with them. I work with adults who want a thoughtful and supportive approach to therapy, especially when stress, anxiety, cognitive concerns, or health changes begin to affect daily life. Clients often tell me they feel heard, understood, and relieved to finally connect the dots between their thoughts, emotions, and brain functioning. If you’re looking for a therapist who combines compassion with clarity, and helps you move forward with confidence, I’d love to connect. Clients often seek me out when they want clarity, structure, and a deeper understanding of how the brain, emotions, and daily functioning are connected, including support with thinking skills, organization, and cognitive changes.
1 Years Experience
Online in Kathleen, GA (Online Only)

Multicultural
Tamara McCord
Licensed Professional Counselor, LMHC, LCAC
I work exclusively with adults who are ready to release old patterns, recover from difficult experiences, and reconnect with themselves and others. Whether you’re struggling with chronic stress, relationship issues, or unresolved trauma, I’ll create a personalized plan to help you heal.
We all have life experiences, and I am not exempt from this. If allowed, our experiences can bring us to a place of fortitude, courage, and hope. You don’t have to carry your pain alone. My clients appreciate how I blend professional expertise with humor and empathy to create a safe, supportive, and transformative therapy experience.
25 Years Experience
Online in Kathleen, GA (Online Only)
Multicultural
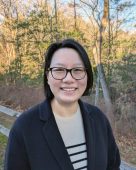
Dr. Yuye Zhang
Psychologist, PhD, MSW
Therapy can be a place to step away from the expectations and pressures that have shaped your life and make room for what you genuinely need. I work with adults who may look like they are doing well on the outside while privately feeling exhausted, disconnected, stuck, or unsure of what comes next. Together, we can explore what you are experiencing now as well as the patterns, relationships, and expectations that may be contributing to it. My practice is intentionally small so that I can be fully present and thoughtful in my work with each client. I aim to create a space where you can explore your experiences openly, better understand yourself, and find ways forward that feel meaningful and sustainable.
11 Years Experience
Online in Kathleen, GA (Online Only)

Multicultural
Kate E. Stephenson
Life Coach, ICF Professional Certified Coach (PCC), Holistic Life, Career & Executive
Have you made time and space for you today? Most of us haven't—and therapy isn't the only way to do it. Consider Holistic Life Coaching instead. As a certified professional coach, I am here to encourage you to take a breath, take a beat to consider who you are, where you are, and if you are feeling satisfaction in your own success. If you aren't, I invite you to have a conversation with yourself about what can be done differently—allow me to moderate that conversation. Together we can help you live into your own definition of success and begin to feel it deeply. To breathe it in and live.
7 Years Experience
Online in Kathleen, GA (Online Only)
Multicultural Therapy therapists in Kathleen, GA Statistics
Multicultural Therapy therapists in Kathleen, GA average 14 years of experience and charge around $203 per session. 100% offer online sessions. The most commonly treated issues are Anxiety or Fears (83%), Depression (73%), and Stress (72%).
Average years in practice
14 Years Experience
Average cost per session
$203
Accept insurance
43%
Offer sliding scale
36%
Gender ID
| 70% |
Female |
|
| 25% |
Male |
|
| 4% |
Non-Binary |
|
| 1% |
Gender Fluid |
|
Session Type
| 51% |
In Person and Online |
|
| 49% |
Online Only |
|
Top Specialties
| 83% | Anxiety or Fears |
| 73% | Depression |
| 72% | Stress |
| 61% | Trauma and PTSD |
| 60% | Self Esteem |
| 53% | Loss or Grief |
| 53% | Women's Issues |
Ages Served
| 99% | Adult |
| 72% | Young Adult |
| 42% | Senior |
| 33% | Teen |
| 17% | Children |
Client Focus
| 72% | Women |
| 58% | LGBTQ+ |
| 45% | Men |
| 40% | Black / African American |
| 37% | Hispanic / Latino |