LGBTQ+ therapists in Nampa, ID
Browse LGBTQ+ therapists in Nampa, Idaho. Compare credentials, specialties and therapeutic approach. Contact a therapist to learn more.
View nearby cities
Serving LGBTQ+
Morgan Mental Health Group
Counselor/Therapist, LPC
What we want to achieve....
We are passionate about helping our clients make positive changes which lead to greater peace, happiness and fulfillment in their lives and relationships. (208)890-7165
9 Years Experience
In-Person Near Nampa, ID

Serving LGBTQ+
Coalesce Mental Health
Licensed Professional Counselor, Licensed Clinical Professional Counselor
I love working with relationships, including the relationship with ourself. I find that many of the anxieties and distressful experiences we have stem from uncertainty about where we stand with others - both personally and professionally. Together, we can gain insight and awareness about who we are, and then we can accept who we are. When acceptance becomes internal, it brings confidence to navigating relationships, and we can feel much more secure with ourselves and in our lives.
12 Years Experience
In-Person Near Nampa, ID
Online in Nampa, ID

Serving LGBTQ+
Icarus Wellness and Recovery
Treatment Center
At Icarus Wellness and Recovery in Boise, we believe that lasting healing begins with compassionate, personalized care that meets you exactly where you are.
Our dedicated team combines evidence-based therapies with a trauma-informed approach to address both mental health and substance use disorders. We are committed to providing a safe, supportive environment where you can rediscover your strength, navigate life's challenges, and build a foundation for long-term recovery.
You do not have to walk this path alone.
Reach out to our team today to take your first step forward.
1 Years Experience
In-Person Near Nampa, ID
Serving LGBTQ+
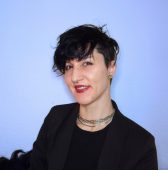
Molly Toomey
Licensed Clinical Social Worker, LCSW
To all those who don't fit neatly into society's norms of gender, sexuality, relationships, and cultures—this is a space for you! As a queer neurodivergent person and immigrant, I'm deeply passionate about connecting my communities to affirming, accessible mental health care. I've helped hundreds of people to get "un-stuck" from difficult pasts and repetitive cycles and to move toward clarity, connection, community, and a life they enjoy living. I'd love to help you on your own journey forward, with me by your side as your ally and co-conspirator.
9 Years Experience
Online in Nampa, ID (Online Only)

Serving LGBTQ+
Melanie Collins
Licensed Professional Counselor, LCPC, LPC, LCMHC, Coach
Therapy with me is collaborative, practical, and refreshingly human. I bring extensive experience in relationships, sexuality, trauma, and neurodivergence, along with a genuine curiosity about what makes each person tick. You won’t find judgment, canned advice, or a one-size-fits-all approach here. Instead, we’ll make sense of the patterns that keep showing up, explore what’s underneath them, and find strategies that actually fit your life. If you’re looking for a therapist who can handle complicated conversations, appreciate nuance, and help you create meaningful change while still being a real person in the room, we may be a great fit.
10 Years Experience
Online in Nampa, ID (Online Only)
LGBTQ+ therapists in Nampa, ID Statistics
LGBTQ+ therapists in Nampa, ID average 15 years of experience and charge around $214 per session. 99% offer online sessions. The most commonly treated issues are Anxiety or Fears (78%), Depression (63%), and Trauma and PTSD (60%).
Average years in practice
15 Years Experience
Average cost per session
$214
Accept insurance
36%
Offer sliding scale
36%
Gender ID
| 63% |
Female |
|
| 28% |
Male |
|
| 5% |
Non-Binary |
|
| 4% |
Gender Fluid |
|
Session Type
| 53% |
In Person and Online |
|
| 46% |
Online Only |
|
| 1% |
In Person Only |
|
Top Specialties
| 78% | Anxiety or Fears |
| 63% | Depression |
| 60% | Trauma and PTSD |
| 56% | LGBTQ+ Issues |
| 56% | Stress |
| 53% | Loss or Grief |
| 47% | Self Esteem |
Ages Served
| 99% | Adult |
| 77% | Young Adult |
| 53% | Senior |
| 37% | Teen |
| 17% | Children |
Client Focus
| 100% | LGBTQ+ |
| 81% | Women |
| 62% | Men |
| 39% | Black / African American |
| 38% | Military / Veterans |