Non-Binary therapists in Champaign, IL
Browse Non-Binary therapists in Champaign, Illinois. Compare credentials, specialties and therapeutic approach. Contact a therapist to learn more.
View nearby cities

Non-Binary
Better Together Mental Health
Licensed Clinical Social Worker, LCSW, LMSW
Finding the right therapist is important. When you find a therapist who understands your needs and can help you feel comfortable therapy is so much more effective. We will take the time to get to know you. We will help you meet your goals and make the changes you desire.
26 Years Experience
Online in Champaign, IL

Non-Binary
Best Therapies, Inc.
Therapist
An inclusive group practice of Emotion Experts, Trauma-Informed Therapists, Gender Guides, and Sex-Positive Relationship Nerds, here to help.
7 Years Experience
Online in Champaign, IL

Non-Binary
Lincoln Park Psychology, Inc
Psychologist, Licensed Clinical Psychologists, LCPC, LPC, LCSW, LSW, CADC, AMFT
At Lincoln Park Psychology, we believe that the therapy process should provide results. Although we offer a range of services for a variety of populations, our goal-focused mindset never shifts. When clients come to LPP, our friendly, compassionate, affirming, and capable clinicians work with the client to develop goals that will set the client up for long-lasting change and a positive shift. It is also our firm belief that therapy should be as enjoyable as possible. Although "the work" can be hard, our clinicians are dedicated to forming a solid relationship built on commonalities, differences, openness, and humor.
17 Years Experience
Online in Champaign, IL
Non-Binary
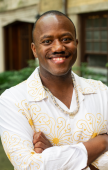
Alignment Psychotherapy, PLLC
Psychologist, LP, PhD
Our practice is grounded in a deep appreciation for the diverse experiences that shape each person’s life. Our founder grew up in Jamaica, Queens, surrounded and supported by three generations of remarkable women—an experience that continues to inform the values of care, resilience, and community that guide our work today. Across our practice, we have the privilege of supporting individuals from a wide range of cultural backgrounds, gender identities, and socioeconomic experiences, each bringing their own unique perspectives and concerns. As a practice founded by a Black, queer, first-generation college graduate, we hold a strong awareness of how power, privilege, and systemic forces shape daily life and mental health. We also recognize the vulnerability it takes to seek therapy. Our work is informed not only by clinical expertise, but by a deep respect for the courage and commitment involved in pursuing healing and meaningful change. This perspective shapes our intention to create a space that is thoughtful, affirming, and responsive to the full complexity of our clients’ lived experiences.
3 Years Experience
Online in Champaign, IL (Online Only)

Non-Binary
Illana Jordan
Therapist, LCSW
For some, therapy is an opportunity to explore complex and overlapping parts of themselves. For others, it is an opportunity to better understand the impact their past is having on their current life circumstances. For each us, therapy should be an opportunity to be heard, to heal and feel better.
16 Years Experience
Online in Champaign, IL (Online Only)
Non-Binary therapists in Champaign, IL Statistics
Non-Binary therapists in Champaign, IL average 13 years of experience and charge around $179 per session. 100% offer online sessions. The most commonly treated issues are Anxiety or Fears (93%), Depression (86%), and LGBTQ+ Issues (79%).
Average years in practice
13 Years Experience
Average cost per session
$179
Accept insurance
71%
Offer sliding scale
43%
Gender ID
| 37% |
Non-Binary |
|
| 30% |
Female |
|
| 22% |
Male |
|
| 11% |
Gender Fluid |
|
Session Type
| 57% |
Online Only |
|
| 43% |
In Person and Online |
|
Top Specialties
| 93% | Anxiety or Fears |
| 86% | Depression |
| 79% | LGBTQ+ Issues |
| 71% | ADHD |
| 64% | Trauma and PTSD |
| 57% | Relationship and Marriage Counseling |
| 57% | Stress |
Ages Served
| 93% | Adult |
| 86% | Young Adult |
| 79% | Teen |
| 71% | Senior |
| 57% | Children |
Client Focus
| 86% | LGBTQ+ |
| 71% | Women |
| 43% | Persons with Disabilities |
| 36% | Black / African American |
| 36% | Hispanic / Latino |