Native American therapists in East Peoria, IL
Browse Native American therapists in East Peoria, Illinois. Compare credentials, specialties and therapeutic approach. Contact a therapist to learn more.
View nearby cities

Serving Native American
Transformations Counseling PLLC
Counselor/Therapist
At Transformations Counseling, we believe that change begins with feeling understood. Our goal is to create a safe, supportive space where you can be heard without judgment and work toward real, lasting growth. Whether you’re struggling with anxiety, relationships, life transitions, or simply feeling stuck, our team is here to help you find clarity and balance.
We use evidence-based approaches combined with genuine compassion to help clients achieve their best selves, build healthier relationships, and create a more balanced life. Each therapist at our practice brings unique experience and warmth, and we work together to match you with the right clinician for your needs.
11 Years Experience
Online in East Peoria, IL
Serving Native American
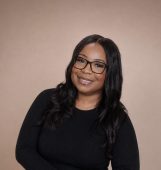
Jasmine Turner
Licensed Professional Counselor, M.Ed, MS, LCPC
We support clients throughout the collaborative therapeutic process, helping individuals discover their voice and experience greater freedom on the journey toward healing, wholeness, and wellness. The goal is to create a safe and supportive environment where individuals feel free to process emotions, be vulnerable and show up authentically. Through empowerment, self-awareness, and accountability, we strive to help clients release unhelpful behaviors, patterns, thought processes, and relationships that will no longer serve the healed and evolved version of themselves.
4 Years Experience
Online in East Peoria, IL (Online Only)

Serving Native American
Donald Glenn
Licensed Professional Counselor, MA, LPC, NCC
I am a passionate and involved therapist, and bring decades of experience as a healthcare provider to the field of psychotherapy. I create a warm and supportive environment for my clients, and will meet you where you are as you begin your journey, whether this is your first time in therapy or you are returning. I believe in treating the client, not the diagnosis, and will tailor a treatment plan to meet your individual needs. I will be an active and involved partner in your treatment, and will not simply sit back and listen.
2 Years Experience
Online in East Peoria, IL

Serving Native American
Nostos Psychotherapy
Psychologist, PsyD
We provide affirming care for 2slgbtqia+ and bipoc individuals, grounded in feminist ideals, we strive to provide a space that is welcoming and empathic for all individuals.
12 Years Experience
Online in East Peoria, IL
Serving Native American
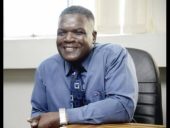
Dr Calvin Young
Counselor/Therapist, PhD, LCPC
My work begins with you. For over two decades, in different locations I have set out to use the power of the spoken word to help those who struggle with psychological and emotional issues. I have not perfected the art of therapy as yet -still trying! I promise to always deploy the best thinking and scientific research in behavior change, and brain support dynamics and technologies to help you to optimize your potential and live your best emotional life.
30 Years Experience
Online in East Peoria, IL (Online Only)
Native American therapists in East Peoria, IL Statistics
Native American therapists in East Peoria, IL average 16 years of experience and charge around $229 per session. 100% offer online sessions. The most commonly treated issues are Anxiety or Fears (86%), Depression (76%), and Loss or Grief (74%).
Average years in practice
16 Years Experience
Average cost per session
$229
Accept insurance
42%
Offer sliding scale
48%
Gender ID
| 61% |
Female |
|
| 31% |
Male |
|
| 5% |
Gender Fluid |
|
| 3% |
Non-Binary |
|
Session Type
| 54% |
Online Only |
|
| 46% |
In Person and Online |
|
Top Specialties
| 86% | Anxiety or Fears |
| 76% | Depression |
| 74% | Loss or Grief |
| 66% | Trauma and PTSD |
| 62% | Self Esteem |
| 54% | Stress |
| 48% | ADHD |
Ages Served
| 100% | Adult |
| 84% | Young Adult |
| 82% | Senior |
| 38% | Teen |
| 24% | Children |
Client Focus
| 100% | Native American |
| 94% | Women |
| 90% | Hispanic / Latino |
| 84% | Black / African American |
| 84% | LGBTQ+ |