Therapists that treat Seniors in Highland, IN
Browse therapists that treat Seniors in Highland, Indiana. Compare credentials, specialties and therapeutic approach. Contact a therapist to learn more.
View nearby cities
Senior
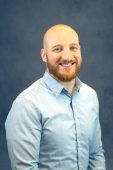
Jacob Biancardi
Licensed Mental Health Counselor, LMHC CSAYC
Clients often tell me they feel truly heard, understood, and empowered after our sessions. My goal is for you to walk away with renewed hope, practical skills, and the belief that lasting change is possible—no matter where you’re starting from.
I bring a creative, accessible perspective to therapy. I blend mindfulness, neuroscience, and the latest in mental health research to help you reframe challenges, build resilience, and move toward your goals with confidence.
10 Years Experience
Online in Highland, IN (Online Only)

Senior
Be BOLD Psychology and Consulting
Psychologist, Ph.D
Be BOLD Psychology and Consulting is a neurodivergent-affirming, LGBTQIA+ celebratory, trauma-informed therapy practice offering virtual therapy across North Carolina and over 43 PSYPACT states, as well as in-person therapy in Durham. Our team provides inclusive care for individuals, couples, families, kids, and teens, with specialties in trauma, identity exploration, life transitions, relationship support, psychological evaluation, court-ordered services, and grief. If you’re looking for a practice that values authenticity, connection, and affirming care, we’re here when you’re ready.
8 Years Experience
Online in Highland, IN
Senior
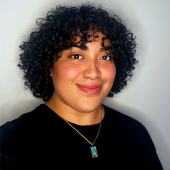
Gracie Orellano
Marriage and Family Therapist, ALMFT
I am all about secure attachment and emotional wellbeing. My clients resonate with my Emotionally Focused and Narrative therapeutic approach as it bridges your narratives with the ongoing emotions that come with them. These modalities offer you the opportunity to feel your emotions and create the open space to be vulnerable with yourself and your loved ones. My approach also provides skills to create emotional safety within your relationships, understand the narratives of your life and how to promote personal growth through mindfulness.
2 Years Experience
Online in Highland, IN (Online Only)

Senior
MN Couples & Family Therapy
Psychologist, Ph.D., L.P.
I believe people have the inherent ability to connect to their best selves if given good tools, opportunities & have the motivation to do the work. I believe it's important to provide as many tools as possible for clients to use on their own. I am active & direct in therapy while also providing empathy & support. I love working with couples & families because the ripple effect of creating positive, healthy relationships is huge & can extend for generations.
30 Years Experience
Online in Highland, IN
Senior
Dr. George Lough
Psychologist, Ph.D., S.E.P.
My therapy is informed by my education, training, personal therapy, and life experiences. My experience doing psychotherapy and being in therapy myself has tauht me that it is important for us to understand how our past history affects our current lives. I am also a cancer-survivor and I have empathy, understanding, and guidance for people going through difficult life circumstances.
48 Years Experience
Online in Highland, IN (Online Only)
Senior therapists in Highland, IN Statistics
Senior therapists in Highland, IN average 18 years of experience and charge around $213 per session. 100% offer online sessions. The most commonly treated issues are Anxiety or Fears (82%), Depression (72%), and Stress (57%).
Average years in practice
18 Years Experience
Average cost per session
$213
Accept insurance
39%
Offer sliding scale
39%
Gender ID
| 65% |
Female |
|
| 32% |
Male |
|
| 2% |
Non-Binary |
|
| 1% |
Gender Fluid |
|
Session Type
| 52% |
In Person and Online |
|
| 48% |
Online Only |
|
Top Specialties
| 82% | Anxiety or Fears |
| 72% | Depression |
| 57% | Stress |
| 53% | Trauma and PTSD |
| 52% | Loss or Grief |
| 46% | Self Esteem |
| 43% | Relationship and Marriage Counseling |
Ages Served
| 100% | Adult |
| 100% | Senior |
| 75% | Young Adult |
| 42% | Teen |
| 18% | Children |
Client Focus
| 51% | Women |
| 40% | LGBTQ+ |
| 36% | Men |
| 29% | Military / Veterans |
| 26% | Black / African American |