Social Isolation therapists in New Bedford, MA
Browse Social Isolation therapists in New Bedford, Massachusetts. Compare credentials, specialties and therapeutic approach. Contact a therapist to learn more.

Social Isolation
Andrea Kamins
Licensed Clinical Social Worker, LICSW, MSW
I support people who struggle to connect with others for a range of reasons. This includes people who continue Covid-19 mitigation measures and feel isolated from others as a result.
10 Years Experience
Online in New Bedford, MA (Online Only)

Social Isolation
Karen Queller
Art Therapist, M.A Expressive Arts Therapy
Discover your inner strengths, and find new ways to connect with yourself and others.
7 Years Experience
Online in New Bedford, MA

Social Isolation
Dr. Kirsten Christensen
Psychologist, Ph.D.
Relationships shape so much of our well-being. Whether you’re feeling disconnected, stuck in patterns, or unsure how to communicate your needs, we help college students, graduate students, professionals, and adults navigate conflict, connection, boundaries, and attachment to build more intentional connections.
9 Years Experience
Online in New Bedford, MA (Online Only)
Social Isolation
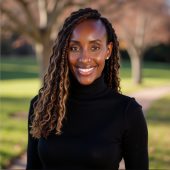
Carolyne Mburu-Gerena
Psychiatric Nurse Practitioner, PMHNP-BC
Social isolation can contribute to feelings of loneliness, sadness, and disconnection from others. Many individuals struggle to maintain relationships due to anxiety, life stress, or past experiences. Treatment focuses on improving emotional wellbeing, strengthening interpersonal skills, and helping individuals reconnect with meaningful relationships and community.
6 Years Experience
Online in New Bedford, MA (Online Only)

Social Isolation
Whitney Hoke
Counselor/Therapist, LMHC, LPC, BC-DMT-R
Support individual in increasing social inclusion activities through CBT and DBT skills.
14 Years Experience
Online in New Bedford, MA (Online Only)
New Bedford is a southeastern Massachusetts city with one of the most distinctive identities of any American city of its size—Herman Melville's Moby-Dick opens here, and the city was once the richest per capita in America thanks to its whaling industry—now home to the highest-volume commercial fishing port in the United States by dollar value, with an economy still anchored by fishing, manufacturing, and logistics. The city has a large Cape Verdean-American community (one of the largest in the world outside Cape Verde), as well as significant Portuguese and Brazilian populations, and the intersection of these communities' mental health needs—including the specific experiences of Cape Verdean identity, immigration, and intergenerational stress—creates important considerations for culturally competent care. Southcoast Health provides behavioral health services, and community health organizations serve the diverse population. Common therapy concerns include fishing industry occupational trauma and risk, Cape Verdean and Portuguese-American identity and immigration stress, economic anxiety, substance use (New Bedford has been significantly affected by opioids), and the mental health challenges of a proud working-class city navigating industrial and demographic change.
Social Isolation therapists in New Bedford, MA Statistics
Social Isolation therapists in New Bedford, MA average 11 years of experience and charge around $197 per session. 100% offer online sessions. The top treatment approaches are Cognitive Behavioral Therapy (CBT) (64%), Compassion-Focused Therapy (CFT) (41%), and Solution-Focused Brief Therapy (SFBT) (36%).
Average years in practice
11 Years Experience
Average cost per session
$197
Accept insurance
41%
Offer sliding scale
45%
Gender ID
| 83% |
Female |
|
| 17% |
Male |
|
Session Type
| 73% |
Online Only |
|
| 27% |
In Person and Online |
|
Top Treatment Approaches
| 64% | Cognitive Behavioral Therapy (CBT) |
| 41% | Compassion-Focused Therapy (CFT) |
| 36% | Solution-Focused Brief Therapy (SFBT) |
| 32% | Integrative Therapy |
| 32% | Person-Centered Therapy (Rogerian) |
| 32% | Psychodynamic Therapy |
| 32% | Relational Psychotherapy |
Ages Served
| 100% | Adult |
| 82% | Young Adult |
| 36% | Senior |
| 23% | Teen |
| 9% | Children |
Client Focus
| 73% | Women |
| 50% | LGBTQ+ |
| 50% | Men |
| 45% | Black / African American |
| 45% | Hispanic / Latino |