Native American therapists in Charlotte, MI
Browse Native American therapists in Charlotte, Michigan. Compare credentials, specialties and therapeutic approach. Contact a therapist to learn more.
Serving Native American
Brighter Health Counseling
Licensed Clinical Social Worker, LMSW, LPC, LLP, LLMSW, LLPC
How do you know when you are in need of a counselor? Perhaps you have already talked with family and friends about your struggles, but nothing seems to help, change doesn’t happen. You’ve experienced a loss, conflict in a relationship or work problems. If you’re a student maybe you are struggling to sort out current and future directions. Maybe you have a sense that something isn’t quite right, you have felt better. Talking to a counselor is the first step toward renewing and regaining fulfillment in your life. Contact us to discuss a counseling session; 517-243-9738 or frontdesk@mibrighterhealth.com
9 Years Experience
In-Person Near Charlotte, MI
Online in Charlotte, MI

Serving Native American
Dr. Allison Williams
Psychologist, Psy.D.
I specialize in helping those who are anxious and overwhelmed learn to recognize and honor their needs - it may mean: giving yourself permission to slow down, scale back, set healthy boundaries, go after what you truly want, and be yourself (authentically and unapologetically). As your partner on this journey, I’ll help you muster your strength, foster your self-acceptance, and feel more at ease.
If you’ve always cast aside your own needs to give everyone and everything your all, I want to help you finally get what you deserve: better relationships, self-care, and greater life satisfaction.
10 Years Experience
Online in Charlotte, MI (Online Only)

Serving Native American
Nancy Hayes-Gary, Psy.D.
Psychologist, Licensed Psychologist, MD , Psy.D.
I have been a psychologist in trauma work for many years, thus I can tailor my approach to meet your needs. Different ages and developmental stages throughout the life span require differing approaches. People generally wait to start therapy until their symptoms are really bothersome. I am currently accepting new patients, with no waiting list.
33 Years Experience
Online in Charlotte, MI (Online Only)
Serving Native American
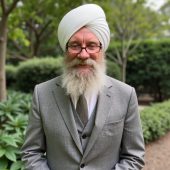
Karambir Khalsa | Khalsa Psychology PLLC
Psychologist, (AZ PSY-005603), Non-Licensed Clinician (CO NLC.0107000)
I create a safe place for you to process your concerns and heal. Sessions are conversational in nature. I want to hear your concerns in your own words and I will reflect back what I am hearing so you can confirm or correct. Our conversations help me to know which techniques are relevant and applicable to your concerns.
3 Years Experience
Online in Charlotte, MI

Serving Native American
Amira Doucette
Licensed Professional Counselor, MA, LPC, LLP, NCC
I've exclusively practiced telehealth since 2015, and have been a psychotherapist for over 25 years. During this time, I've been fortunate enough to have worked with clients from all over the world. As I've helped with their concerns, I repeatedly find the single most important conduit to change is the relationship we forge in therapy. In this relationship I am without judgment: I am respectful, understanding, and accepting.
26 Years Experience
Online in Charlotte, MI (Online Only)
Native American therapists in Charlotte, MI Statistics
Native American therapists in Charlotte, MI average 17 years of experience and charge around $247 per session. 100% offer online sessions. The most commonly treated issues are Anxiety or Fears (88%), Depression (79%), and Loss or Grief (70%).
Average years in practice
17 Years Experience
Average cost per session
$247
Accept insurance
37%
Offer sliding scale
47%
Gender ID
| 69% |
Female |
|
| 27% |
Male |
|
| 2% |
Gender Fluid |
|
| 2% |
Non-Binary |
|
Session Type
| 58% |
Online Only |
|
| 42% |
In Person and Online |
|
Top Specialties
| 88% | Anxiety or Fears |
| 79% | Depression |
| 70% | Loss or Grief |
| 65% | Trauma and PTSD |
| 60% | Self Esteem |
| 49% | Divorce |
| 49% | Stress |
Ages Served
| 100% | Adult |
| 88% | Young Adult |
| 77% | Senior |
| 35% | Teen |
| 21% | Children |
Client Focus
| 100% | Native American |
| 95% | Women |
| 86% | Hispanic / Latino |
| 84% | Black / African American |
| 79% | LGBTQ+ |