Elderly Persons Disorders therapists in Clinton Township, MI
Browse Elderly Persons Disorders therapists in Clinton Township, Michigan. Compare credentials, specialties and therapeutic approach. Contact a therapist to learn more.

Elderly Issues
Dr. Laurene Saad-Younis
Psychologist, PsyD, LP
Aging can bring unique emotional, cognitive, and medical challenges that affect both individuals and their families. We provide supportive therapy for concerns related to memory changes, cognitive decline, depression, anxiety, adjustment to health conditions, loss of independence, and caregiver stress. We also offer psychological and neuropsychological evaluations to assist with diagnostic clarification, treatment planning, and recommendations to support quality of life and daily functioning.
14 Years Experience
In-Person Near Clinton Township, MI
Online in Clinton Township, MI
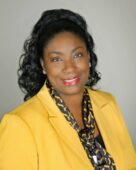
Elderly Issues
Wendy Hooker
Licensed Clinical Social Worker, LMSW, C-ASWCM, CBIS, CAMF, SAP
As society ages, many families must quickly learn to navigate a plan of care for a senior family member. Together we will address and create the best care plan for your loved one. We will also discuss the importance of stress management and self-care.
28 Years Experience
In-Person Near Clinton Township, MI
Online in Clinton Township, MI

Elderly Issues
Transformational Choices
Therapist, LMSW, LPC, CAADC, LLMSW
With a plethora of therapists on our team we have the ability to meet many needs that include working with elderly. We will be able to fit you with a therapist who will meet you wherever you are on your journey. We are here to serve you.
In-Person Near Clinton Township, MI
Online in Clinton Township, MI

Elderly Issues
Chris Mullin
Licensed Clinical Social Worker, LMSW
Personal and professional experiences relating to and working to older adults has led to an interest in and unique understanding of the various challenges that present as we age.
17 Years Experience
Online in Clinton Township, MI

Elderly Issues
Kreins Psychological Services
Psychologist, PhD, PsyD
As a psychologist specializing in geriatric care, my approach to treatment is holistic, person-centered, and tailored to the unique needs of older adults. I prioritize building a trusting and compassionate therapeutic relationship, recognizing the diverse life experiences and challenges that come with aging. Through evidence-based therapies such as cognitive-behavioral therapy (CBT), supportive counseling, and reminiscence therapy, I address a wide range of concerns including adjustment to life transitions, grief and loss, depression, anxiety, and cognitive changes. I collaborate closely with other healthcare professionals and family members to ensure comprehensive care and support. Additionally, I integrate strengths-based approaches to help older adults identify and leverage their resilience and coping skills. My goal is to promote emotional well-being, enhance quality of life, and empower older adults to navigate the aging process with dignity and resilience.
26 Years Experience
Online in Clinton Township, MI
Elderly Persons Disorders therapists in Clinton Township, MI Statistics
Elderly Persons Disorders therapists in Clinton Township, MI average 18 years of experience and charge around $191 per session. 100% offer online sessions. The top treatment approaches are Cognitive Behavioral Therapy (CBT) (76%), Solution-Focused Brief Therapy (SFBT) (48%), and Behavioral Therapy (44%).
Average years in practice
18 Years Experience
Average cost per session
$191
Accept insurance
68%
Offer sliding scale
40%
Gender ID
| 57% |
Female |
|
| 40% |
Male |
|
| 3% |
Gender Fluid |
|
Session Type
| 68% |
In Person and Online |
|
| 32% |
Online Only |
|
Top Treatment Approaches
| 76% | Cognitive Behavioral Therapy (CBT) |
| 48% | Solution-Focused Brief Therapy (SFBT) |
| 44% | Behavioral Therapy |
| 40% | Existential / Humanistic Therapy |
| 36% | Acceptance & Commitment Therapy (ACT) |
| 36% | Eclectic Therapy |
| 36% | Motivational Interviewing (MI) |
Ages Served
| 100% | Adult |
| 96% | Senior |
| 64% | Young Adult |
| 56% | Teen |
| 24% | Children |
Client Focus
| 60% | Women |
| 52% | Men |
| 44% | LGBTQ+ |
| 40% | Persons with Disabilities |
| 32% | Black / African American |