LGBTQ+ Issues therapists in Empire, MI
Browse LGBTQ+ Issues therapists in Empire, Michigan. Compare credentials, specialties and therapeutic approach. Contact a therapist to learn more.

LGBTQ+
Joe Groninga
Psychologist, PsyD, LP
LGBTQ+ issues are ones which are close to my heart as I am a gay-identified man. LGBTQ+ individuals share many unique experiences due to their sexual orientation and gender identity. The symptoms that result from those experience are often more accurately understood by a psychologist who has shared in those experiences. This understanding facilitates greater affirmation and validation of your needs, along with designing a more effective approach to achieve your desired symptom relief. Helping people in our LGBTQ+ community is one of the primary reasons I decided to become a psychologist.
21 Years Experience
Online in Empire, MI

LGBTQ+
Josh Murray- Hopeful Minds
Psychologist, MA, LLP
LGBTQIA-specific therapy provides affirming care for individuals whose gender identity and/or sexuality generally differ from those who identify as cisgender (gender and/or expression aligns with sex assigned at birth) and heterosexual (attracted to the opposite sex).
Stigma and “minority stress”, including experiences of violence, discrimination, prejudice, and other negative social encounters due to gender identity, expression, or sexuality, contribute to a greater likelihood that people in this community will develop mental health challenges.
LGBTQ therapy provided by licensed mental health professionals is a valuable resource for members of the LGBTQIA community. Finding the right therapist who understands the challenges of gender transition, gender nonconforming identity, and discrimination can be critical to resolving mental health issues, relationship issues, and anger management. LGBTQ therapy offers a safe, supportive space to discuss lesbian, gay, bisexual, and gender nonconforming concerns, providing immediate help and affirming care.
5 Years Experience
Online in Empire, MI

LGBTQ+
Dr. Kimberly E. Johnson
Psychologist, PsyD, HSPP, APIT
I have worked with LGBTQ clients for over a decade and consider myself an Ally. I am in tune to the unique challenges, bias and issues faced by this population. All to frequently LGBTQ clients all have been subject to trauma, disconnection from family, work or social discrimination based on their gender and sexual identity. Whether dealing with individual, partner or family issues I am an experienced resource.
19 Years Experience
Online in Empire, MI (Online Only)
LGBTQ+
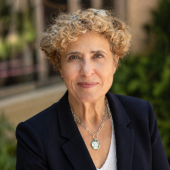
Dr. Amy Hecht
Psychologist, PhD
I work with individuals and couples across the LGBTQ+ spectrum, supporting a wide range of experiences related to identity, relationships, and family building. This can include exploring questions of identity and self-understanding, navigating coming out, managing family dynamics, and building affirming, meaningful relationships.
I have particular experience working with LGBTQ+ individuals and couples pursuing non-traditional paths to parenthood, including adoption, surrogacy, and donor conception. I understand both the unique stressors and the profound strengths that can come with these journeys.
My approach is affirming, nuanced, and grounded in deep respect for each person’s lived experience. I aim to create a space where clients feel fully seen and understood, while also helping them navigate challenges with clarity, confidence, and a strong sense of self.
26 Years Experience
Online in Empire, MI

LGBTQ+
Glenn Sample
Psychologist, Psy.D., MSCP
Your identity and experiences deserve to be understood and respected within the therapeutic relationship. I provide an affirming, non-judgmental space for LGBTQ+ individuals to explore the unique experiences, relationships, and challenges that may affect their emotional well-being.
Therapy can offer an opportunity to explore identity, self-acceptance, relationships, family dynamics, stress, anxiety, and other concerns in an environment where you can feel safe being yourself. My approach is collaborative and individualized, recognizing that every person’s experiences with identity and belonging are different.
Together, we can focus on your goals, build skills for navigating challenges, and strengthen your ability to live in a way that feels authentic and meaningful to you.
12 Years Experience
Online in Empire, MI (Online Only)
LGBTQ+ Issues therapists in Empire, MI Statistics
LGBTQ+ Issues therapists in Empire, MI average 15 years of experience and charge around $202 per session. 100% offer online sessions. The top treatment approaches are Cognitive Behavioral Therapy (CBT) (70%), Acceptance & Commitment Therapy (ACT) (43%), and Psychodynamic Therapy (37%).
Average years in practice
15 Years Experience
Average cost per session
$202
Accept insurance
41%
Offer sliding scale
37%
Gender ID
| 58% |
Female |
|
| 33% |
Male |
|
| 5% |
Non-Binary |
|
| 4% |
Gender Fluid |
|
Session Type
| 56% |
In Person and Online |
|
| 44% |
Online Only |
|
Top Treatment Approaches
| 70% | Cognitive Behavioral Therapy (CBT) |
| 43% | Acceptance & Commitment Therapy (ACT) |
| 37% | Psychodynamic Therapy |
| 37% | Existential / Humanistic Therapy |
| 37% | Person-Centered Therapy (Rogerian) |
| 33% | Emotionally Focused Therapy (EFT) |
| 33% | Multicultural Therapy |
Ages Served
| 99% | Adult |
| 76% | Young Adult |
| 54% | Senior |
| 44% | Teen |
| 21% | Children |
Client Focus
| 81% | LGBTQ+ |
| 63% | Women |
| 50% | Men |
| 35% | Black / African American |
| 30% | Hispanic / Latino |