Somatic therapists in Niles, MI
Browse Somatic therapists in Niles, Michigan. Compare credentials, specialties and therapeutic approach. Contact a therapist to learn more.

Somatic
Jocelyn Stott ~ Circle 3 Counseling
Licensed Clinical Social Worker, LCSW/LMSW, CBEIP-MH
I offer a safe and private space to process potentially difficult experiences and emotions.
8 Years Experience
Online in Niles, MI (Online Only)

Somatic
GRIS ALVES
Counselor/Therapist, Compassionate Inquiry, Trauma Informed Mindfulness Teacher
I offer compassionate, trauma-informed online therapy for individuals seeking healing, clarity, and meaningful change. My practice is rooted in mindfulness, somatic awareness, and evidence-based therapy, and I am certified in Compassionate Inquiry®, a trauma-informed approach developed by Dr. Gabor Maté that supports deep emotional processing and nervous system regulation. Clients often reach out when they feel overwhelmed, disconnected from themselves, or ready to move beyond survival patterns related to anxiety, depression, addiction recovery, grief, or trauma. Therapy with me is collaborative, culturally sensitive, and grounded in safety, helping clients reconnect with their inner wisdom and build lasting emotional resilience.
11 Years Experience
Online in Niles, MI

Somatic
Renee Woodall
Psychologist, Ph.D.
I provide therapy for individuals and couples in midlife or retirement—helping you move through life’s changes with clarity, purpose, and hope. You’ve worked hard and cared for others, yet lately something feels off. Whether you’re feeling burned out, overwhelmed by life’s demands, or unsure about what comes next, therapy offers a space to slow down, heal, grow, and begin creating a life that feels more grounded, fulfilling, and enjoyable again.
27 Years Experience
Online in Niles, MI
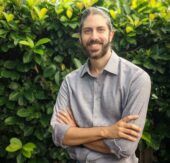
Somatic
Dr. JD Wright
Psychologist, PhD, Licensed Psychologist
My approach is grounded in an understanding of the impact of trauma, recognizing that our struggles always exist in the context of our environments and histories. I weave mindfulness and positive psychology into our sessions, aiming not just for 'okay,' but for a life that feels truly meaningful and fulfilling. Trained in clinical hypnosis, EMDR, ACT, and CBT, I bring a diverse toolkit to tailor our sessions to your unique needs.
I see our time together as a collaborative space, where your feedback and active participation shape the path to your well-being. There's no one-size-fits-all in therapy—I believe in finding the approach that resonates best with you and addresses your specific concerns. Let's embark on this journey towards positive change together.
6 Years Experience
Online in Niles, MI

Somatic
Grief Recovery Center
Licensed Mental Health Counselor, LPC, LCSW, LMFT, LP, LPA-IPA
At Grief Recovery Center, our vision is a world where no one is afraid to seek mental health help, regardless of background. We believe that everyone deserves healing, hope, and compassionate mental health care. Our diverse group of mental health counselors and psychologists can help you navigate various life transitions and challenges through compassionate counseling and therapy in a cohesive and supportive environment.
15 Years Experience
Online in Niles, MI
Somatic Therapy therapists in Niles, MI Statistics
Somatic Therapy therapists in Niles, MI average 15 years of experience and charge around $192 per session. 100% offer online sessions. The most commonly treated issues are Anxiety or Fears (84%), Trauma and PTSD (74%), and Stress (68%).
Average years in practice
15 Years Experience
Average cost per session
$192
Accept insurance
45%
Offer sliding scale
44%
Gender ID
| 65% |
Female |
|
| 25% |
Male |
|
| 7% |
Gender Fluid |
|
| 3% |
Non-Binary |
|
Session Type
| 61% |
In Person and Online |
|
| 39% |
Online Only |
|
Top Specialties
| 84% | Anxiety or Fears |
| 74% | Trauma and PTSD |
| 68% | Stress |
| 65% | Depression |
| 65% | Self Esteem |
| 56% | Loss or Grief |
| 52% | Women's Issues |
Ages Served
| 100% | Adult |
| 65% | Young Adult |
| 56% | Senior |
| 32% | Teen |
| 13% | Children |
Client Focus
| 58% | Women |
| 55% | LGBTQ+ |
| 42% | Men |
| 27% | Military / Veterans |
| 24% | Black / African American |