Native American therapists in Winona, MN
Browse Native American therapists in Winona, Minnesota. Compare credentials, specialties and therapeutic approach. Contact a therapist to learn more.
Serving Native American
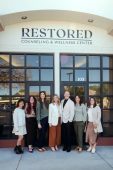
Restored Counseling & Wellness Center, PLLC
Marriage and Family Therapist, LMFT, LPC, NMD
Your brain, body, and relationships were designed to work for you — not against you. At Restored, we believe healing is about more than symptom management. It's about reclaiming your sense of self, rebuilding connection, and growing into the life and purpose you were meant for. Our therapists and naturopathic doctors share a deep commitment to treating the whole person — because sustainable restoration requires addressing mind, body, spirit, and relationships together.
14 Years Experience
Online in Winona, MN

Serving Native American
Tara Murphy
Psychologist, Psy.D.
I believe every human being has inherent value, yet so many of us carry deep shame from past experiences that tell us otherwise—messages like “I’m bad,” “I’m too much,” “I’m unlovable,” or “If I show myself, I’ll be rejected.” These beliefs can quietly shape how we see ourselves, our relationships, and what we think is possible. In therapy, I work to help uncover and soften these old burdens so they no longer hold you back. My style is warm, collaborative, and deeply respectful of the courage it takes to show up. Together, we’ll build a space where you can feel seen in your wholeness, reconnect with your own inner wisdom, and move toward a life that feels freer and more grounded.
29 Years Experience
Online in Winona, MN (Online Only)
Serving Native American
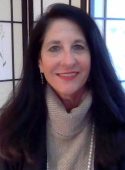
Dr. Carol H Paulson
Psychologist, PhD, LP, RN, APRN, DMin
Dr. Carol brings many years of experience in healthcare and mental health care, along with a broad range of therapeutic approaches and a holistic perspective. As a compassionate and engaged therapist, she helps clients explore the deeper patterns shaping their lives and learn to work with their strengths to find one's best life. Her areas of focus include depth psychology, inner work, nervous-system regulation, attachment concerns, repetitive patterns, trauma recovery, healthier thinking and living, and the emotional impact of medical issues.
44 Years Experience
Online in Winona, MN (Online Only)

Serving Native American
Alignment Psychotherapy, PLLC
Psychologist, LP, PhD
Our practice is grounded in a deep appreciation for the diverse experiences that shape each person’s life. Our founder grew up in Jamaica, Queens, surrounded and supported by three generations of remarkable women—an experience that continues to inform the values of care, resilience, and community that guide our work today. Across our practice, we have the privilege of supporting individuals from a wide range of cultural backgrounds, gender identities, and socioeconomic experiences, each bringing their own unique perspectives and concerns. As a practice founded by a Black, queer, first-generation college graduate, we hold a strong awareness of how power, privilege, and systemic forces shape daily life and mental health. We also recognize the vulnerability it takes to seek therapy. Our work is informed not only by clinical expertise, but by a deep respect for the courage and commitment involved in pursuing healing and meaningful change. This perspective shapes our intention to create a space that is thoughtful, affirming, and responsive to the full complexity of our clients’ lived experiences.
3 Years Experience
Online in Winona, MN (Online Only)

Serving Native American
Teona Amble
Psychologist, Ph.D., LP
Are you feeling overwhelmed? Are you unsure of how to make changes in your life? Do you want to to take back control of your health? Now is the time to focus on your wellness. I am here to create a wellness plan with you to improve your mood and stress management as well as help you cope with life changes and stress. I take pride in helping my clients become their own therapists, more confident in managing life’s demands. I look forward to helping build your toolbox to improve your quality of life. I treat my clients with respect and empathy, valuing connection in healing.
15 Years Experience
Online in Winona, MN (Online Only)
Native American therapists in Winona, MN Statistics
Native American therapists in Winona, MN average 17 years of experience and charge around $247 per session. 100% offer online sessions. The most commonly treated issues are Anxiety or Fears (90%), Depression (79%), and Loss or Grief (77%).
Average years in practice
17 Years Experience
Average cost per session
$247
Accept insurance
33%
Offer sliding scale
44%
Gender ID
| 64% |
Female |
|
| 30% |
Male |
|
| 4% |
Non-Binary |
|
| 2% |
Gender Fluid |
|
Session Type
| 62% |
Online Only |
|
| 38% |
In Person and Online |
|
Top Specialties
| 90% | Anxiety or Fears |
| 79% | Depression |
| 77% | Loss or Grief |
| 67% | Trauma and PTSD |
| 62% | Self Esteem |
| 56% | Stress |
| 54% | Divorce |
Ages Served
| 100% | Adult |
| 87% | Young Adult |
| 77% | Senior |
| 31% | Teen |
| 13% | Children |
Client Focus
| 100% | Native American |
| 95% | Women |
| 90% | Hispanic / Latino |
| 79% | Black / African American |
| 79% | Persons with Disabilities |