Native American therapists in Papillion, NE
Browse Native American therapists in Papillion, Nebraska. Compare credentials, specialties and therapeutic approach. Contact a therapist to learn more.
Serving Native American
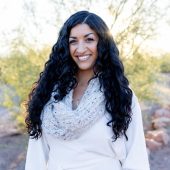
Dr. Iziz Malak
Psychologist, Clinical Psychologist
I believe people can build the lives they want to live by aligning themselves with their values, which may shift with the various seasons of life.
12 Years Experience
Online in Papillion, NE

Serving Native American
Dr. Stéphanie Gamache, PhD
Hypnotherapist, PhD
Something in you may already know that what you're carrying runs deeper than the problem that brought you here. I work with individuals and couples who want to understand what is happening in their relationships, in their sexual lives, and in themselves, including anxiety and patterns that keep repeating, and what might be getting in the way. I work psychoanalytically, and I draw on clinical sexology, hypnosis, and awareness of the body.
I'm curious about what happens to our own wants and our sense of ourselves when someone else becomes important to us, and how that shows up in the way we desire and the way we hold back. The work is exploratory and depth-oriented, and people usually meet with me regularly over time. It tends to suit people who want to understand themselves more fully, and it is less likely to suit someone looking for a few quick sessions.
I offer a free 10-minute introductory consultation, and I meet with people primarily online, including internationally.
7 Years Experience
Online in Papillion, NE (Online Only)

Serving Native American
Dr. Carol H Paulson
Psychologist, PhD, LP, RN, APRN, DMin
Dr. Carol brings many years of experience in healthcare and mental health care, along with a broad range of therapeutic approaches and a holistic perspective. As a compassionate and engaged therapist, she helps clients explore the deeper patterns shaping their lives and learn to work with their strengths to find one's best life. Her areas of focus include depth psychology, inner work, nervous-system regulation, attachment concerns, repetitive patterns, trauma recovery, healthier thinking and living, and the emotional impact of medical issues.
44 Years Experience
Online in Papillion, NE (Online Only)

Serving Native American
Nancy Hayes-Gary, Psy.D.
Psychologist, Licensed Psychologist, MD , Psy.D.
I have been a psychologist in trauma work for many years, thus I can tailor my approach to meet your needs. Different ages and developmental stages throughout the life span require differing approaches. People generally wait to start therapy until their symptoms are really bothersome. I am currently accepting new patients, with no waiting list.
33 Years Experience
Online in Papillion, NE (Online Only)
Serving Native American
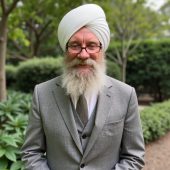
Karambir Khalsa | Khalsa Psychology PLLC
Psychologist, (AZ PSY-005603), Non-Licensed Clinician (CO NLC.0107000)
I create a safe place for you to process your concerns and heal. Sessions are conversational in nature. I want to hear your concerns in your own words and I will reflect back what I am hearing so you can confirm or correct. Our conversations help me to know which techniques are relevant and applicable to your concerns.
3 Years Experience
Online in Papillion, NE
Native American therapists in Papillion, NE Statistics
Native American therapists in Papillion, NE average 17 years of experience and charge around $237 per session. 100% offer online sessions. The most commonly treated issues are Anxiety or Fears (86%), Depression (71%), and Loss or Grief (71%).
Average years in practice
17 Years Experience
Average cost per session
$237
Accept insurance
33%
Offer sliding scale
43%
Gender ID
| 66% |
Female |
|
| 30% |
Male |
|
| 2% |
Gender Fluid |
|
| 2% |
Non-Binary |
|
Session Type
| 60% |
Online Only |
|
| 40% |
In Person and Online |
|
Top Specialties
| 86% | Anxiety or Fears |
| 71% | Depression |
| 71% | Loss or Grief |
| 62% | Trauma and PTSD |
| 60% | Self Esteem |
| 52% | Stress |
| 48% | Divorce |
Ages Served
| 100% | Adult |
| 88% | Young Adult |
| 74% | Senior |
| 36% | Teen |
| 12% | Children |
Client Focus
| 100% | Native American |
| 93% | Women |
| 90% | Hispanic / Latino |
| 83% | Black / African American |
| 81% | Asian |