Therapists in Sidney, NE
Browse therapists in Sidney, Nebraska. Compare credentials, specialties and therapeutic approach. Contact a therapist to learn more.
View nearby cities
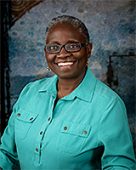
Octave Therapy Licensed Clinical Social Work Inc
Licensed Clinical Social Worker, Licensed Clinical Social Worker, LCSW
At Octave Therapy Licensed Clinical Social Work Inc I encourage and motivate adult clients. Clients report feeling healthier, happier and more motivated. They are able to love who they are, spend awesome time with family, develop healthier relationships at home, at work, their community and their world.
13 Years Experience
Online in Sidney, NE (Online Only)

Dr. Mike Strand
Psychologist, PsyD
Hey there! I’m Mike Strand, an experienced psychologist with over 15 years of dedication to guiding individuals on their journey of self-improvement. My expertise lies in helping clients overcome emotional challenges to enhance personal growth and strengthen relationships. I recognize that seeking support can be difficult, which is why I will strive to make therapy as welcoming and approachable as possible. Our sessions are collaborative, tailored to your specific needs, facilitating deep and lasting transformation.
18 Years Experience
Online in Sidney, NE

Jill Morris
Psychologist, PhD, LP
I'm an action oriented Clinical Psychologist who specializes in anxiety, stress, and trauma. I help people identify beliefs and behaviors that are interfering in their live and help them move towards their goals.
12 Years Experience
Online in Sidney, NE
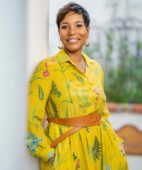
Dr. Kristyn Neckles
Psychologist, Psy.D.
You may be successful, capable, and accustomed to handling a lot, yet still find yourself feeling overwhelmed, disconnected, anxious, or simply tired of holding everything together. Perhaps you are navigating burnout, relationship challenges, grief, trauma, a major life transition, or the pressure of being the person others consistently depend on.
I work with adults and couples who want more than a place to simply talk. Together, we make sense of the patterns keeping you stuck, strengthen the tools you already possess, and develop practical strategies for meaningful and lasting change. My approach is warm, collaborative, culturally responsive, and gently direct, with therapy tailored to your experiences, values, relationships, and goals.
You do not have to wait until life is falling apart to seek support. Therapy can also be a space to pause, gain clarity, strengthen your relationships, reconnect with yourself, and decide how you want to move forward. My goal is to help you move beyond simply managing life toward living with greater intention, connection, and resilience.
12 Years Experience
Online in Sidney, NE (Online Only)
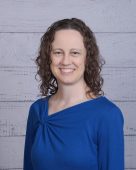
Kristy Fujiura Counseling
Psychologist, Licensed Psychologist, Psy.D.
My gentle, calm presence naturally creates a space where people can feel safe to feel truly seen, especially for those who have felt misunderstood for most of their lives. With both humility and courage, I offer insight and wisdom shaped by my professional training, as well as my personal journey through the loneliness and grief of navigating cultural identity and experiencing infertility.
11 Years Experience
Online in Sidney, NE (Online Only)
Sidney, NE therapists Statistics
Therapists in Sidney, NE average 17 years of experience and charge around $215 per session. 100% offer online sessions. The most commonly treated issues are Anxiety or Fears (84%), Depression (69%), and Stress (55%).
Average years in practice
17 Years Experience
Average cost per session
$215
Accept insurance
36%
Offer sliding scale
33%
Gender ID
| 66% |
Female |
|
| 31% |
Male |
|
| 2% |
Non-Binary |
|
| 1% |
Gender Fluid |
|
Session Type
| 53% |
In Person and Online |
|
| 47% |
Online Only |
|
Top Specialties
| 84% | Anxiety or Fears |
| 69% | Depression |
| 55% | Stress |
| 48% | Trauma and PTSD |
| 44% | Loss or Grief |
| 44% | Self Esteem |
| 41% | Social Anxiety |
Ages Served
| 99% | Adult |
| 68% | Young Adult |
| 50% | Senior |
| 35% | Teen |
| 15% | Children |
Client Focus
| 52% | Women |
| 35% | Men |
| 35% | LGBTQ+ |
| 23% | Military / Veterans |
| 19% | Black / African American |