Native American therapists in Laconia, NH
Browse Native American therapists in Laconia, New Hampshire. Compare credentials, specialties and therapeutic approach. Contact a therapist to learn more.
Serving Native American
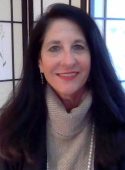
Dr. Carol H Paulson
Psychologist, PhD, LP, RN, APRN, DMin
Dr. Carol brings many years of experience in healthcare and mental health care, along with a broad range of therapeutic approaches and a holistic perspective. As a compassionate and engaged therapist, she helps clients explore the deeper patterns shaping their lives and learn to work with their strengths to find one's best life. Her areas of focus include depth psychology, inner work, nervous-system regulation, attachment concerns, repetitive patterns, trauma recovery, healthier thinking and living, and the emotional impact of medical issues.
44 Years Experience
Online in Laconia, NH (Online Only)
Serving Native American
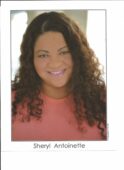
Dr. Sheryl Ferguson
Psychologist, (Psy.D.)
Hello! It may be difficult to know whether your problems are just a phase and there are many situations, even positive ones, which may cause stress. I am committed to careful listening and in providing a safe, warm and caring space (online only) to facilitate and foster growth and development. I'm here to assist and provide guidance as you gain insight about yourself and those around you, as you focus on empowerment towards self love and to being as authentic as you can be.
My mottos: 'Helping you find your way' 'Serving those who serve (First Responders)' Call today: (954) 476 - 0255
23 Years Experience
Online in Laconia, NH (Online Only)

Serving Native American
The Adult ADHD Clinic
Psychologist, Psyd, PsyPact
The Adult ADHD Clinic offers a streamlined approach to meeting your psychological testing needs. Whether you are seeking clarification regarding a diagnosis of ADHD, require a report for academic accommodations, or are in need of an updated report based on changing needs, The Adult ADHD Clinic is your answer. We are PsyPact certified and our tele-assessment services are available in 43 states.
14 Years Experience
Online in Laconia, NH (Online Only)

Serving Native American
Jay Shaw
Hypnotherapist, CHt (Certified Hypnotherapist)
Most high performers don't have a strategy problem. They have an identity problem. The beliefs, triggers, and automatic responses running in the background are the real ceiling and talking about them only gets you so far. I'm Jay Shaw, a Certified Clinical Hypnotherapist and creator of Identity 2.0 Neural Reprogramming, based in Richardson, TX and serving the greater Dallas area and clients nationwide. My work targets the subconscious architecture driving your patterns and replaces it at the root. A systematic rebuild across 12 dimensions of identity tailored specifically to you. In-person and virtual options available. If you're done managing what you want eliminated, book a strategy call at hypnosisdallastx.com.
8 Years Experience
Online in Laconia, NH

Serving Native American
Dr. Samira Paul Olive Tree Psychology Clinic LLC
Psychologist, PsyD
At Olive Tree Psychology Clinic LLC, we believe that healing requires entering a space where you feel truly seen, understood, and respected. We honor your presence and we meet you exactly where you are.
7 Years Experience
Online in Laconia, NH (Online Only)
Native American therapists in Laconia, NH Statistics
Native American therapists in Laconia, NH average 18 years of experience and charge around $250 per session. 100% offer online sessions. The most commonly treated issues are Anxiety or Fears (89%), Depression (74%), and Loss or Grief (74%).
Average years in practice
18 Years Experience
Average cost per session
$250
Accept insurance
31%
Offer sliding scale
46%
Gender ID
| 62% |
Female |
|
| 34% |
Male |
|
| 2% |
Gender Fluid |
|
| 2% |
Non-Binary |
|
Session Type
| 63% |
Online Only |
|
| 37% |
In Person and Online |
|
Top Specialties
| 89% | Anxiety or Fears |
| 74% | Depression |
| 74% | Loss or Grief |
| 60% | Self Esteem |
| 60% | Trauma and PTSD |
| 51% | Stress |
| 49% | Divorce |
Ages Served
| 100% | Adult |
| 91% | Young Adult |
| 74% | Senior |
| 29% | Teen |
| 11% | Children |
Client Focus
| 100% | Native American |
| 94% | Women |
| 86% | Hispanic / Latino |
| 83% | Black / African American |
| 80% | Persons with Disabilities |