Behavioral therapists in Capitol Hill, CNMI
Browse Behavioral therapists in Capitol Hill, Northern Mariana Islands. Compare credentials, specialties and therapeutic approach. Contact a therapist to learn more.
View nearby cities

Behavioral
Andrew D. Sapp
Psychologist, PhD
With over two decades of experience working in diverse therapeutic environments—ranging from outpatient clinics to psychiatric hospitals, adventure programs, residential treatment facilities, schools, juvenile corrections, and a military hospital—I bring a wide-ranging perspective to problem-solving and overcoming life's obstacles. As the Founder & President of two award-winning mental health centers with a staff 150, I've gained a holistic and interdisciplinary approach to care.
20 Years Experience
Online in Capitol Hill, CNMI (Online Only)
Behavioral
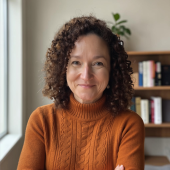
Maria Elena Lara, Ph.D. LLC
Psychologist, Ph.D.
As a licensed Ph.D. clinical psychologist for over twenty-five years, I have helped hundreds of clients to understand not only why they feel debilitated and burdened but how to overcome these challenges and achieve greater balance in their lives.
Together, we can make changes that will last, and give you greater hope for the future, and a healthy, more complete sense of well-being.
26 Years Experience
Online in Capitol Hill, CNMI
Behavioral
Jessica Anderson, PsyD
Psychologist, PsyD
Dr. Jessica Anderson is a licensed school and clinical psychologist with experience supporting individuals and families from childhood to young adults. Dr. Anderson specializes in Autism, ADHD, depression, anxiety, college planning, and life transitions. She also has a dedication to serving young adults as they navigate independence and determine career goals.
21 Years Experience
Online in Capitol Hill, CNMI (Online Only)

Behavioral
Bold Expressions Therapy
Psychologist, Psy.D.
As a member of the LGBTQIA+ community, a trauma survivor, and someone with a chronic pain disorder; I approach the work that I do from a place of empathy and personal understanding. I have an intense passion for understanding personal identity and the way race, culture, class, and sexuality come together to form what we believe about ourselves and what we feel we can accomplish in our lives. Anxiety and trauma can live in our bodies - together we will create a relationship that fosters dynamic and lasting growth, tapping into undiscovered reserves of resiliency that will help navigate the past and prepare for a more hopeful future.
6 Years Experience
Online in Capitol Hill, CNMI

Behavioral
Dr. Jenny Shields
Psychologist
Dr. Jenny Shields specializes in supporting healthcare providers, executives, and high-achieving professionals who feel overwhelmed, burned out, or stuck—especially those who’ve dedicated their careers to caring for others while quietly neglecting their own well-being. Her approach is deeply rooted in evidence-based behavioral science, balanced with genuine warmth, empathy, and down-to-earth candor. Known for quickly pinpointing core issues, Dr. Shields offers clarity and practical tools to help clients step out of survival mode and into meaningful, lasting change—reclaiming their sense of self, purpose, and professional fulfillment.
12 Years Experience
Online in Capitol Hill, CNMI
Behavioral Therapy therapists in Capitol Hill, CNMI Statistics
Behavioral Therapy therapists in Capitol Hill, CNMI average 17 years of experience and charge around $215 per session. 100% offer online sessions. The most commonly treated issues are Anxiety or Fears (93%), Depression (77%), and Social Anxiety (63%).
Average years in practice
17 Years Experience
Average cost per session
$215
Accept insurance
40%
Offer sliding scale
35%
Gender ID
| 66% |
Female |
|
| 31% |
Male |
|
| 3% |
Non-Binary |
|
Session Type
| 51% |
In Person and Online |
|
| 49% |
Online Only |
|
Top Specialties
| 93% | Anxiety or Fears |
| 77% | Depression |
| 63% | Social Anxiety |
| 63% | Stress |
| 50% | Self Esteem |
| 49% | ADHD |
| 49% | Trauma and PTSD |
Ages Served
| 94% | Adult |
| 74% | Young Adult |
| 56% | Senior |
| 50% | Teen |
| 21% | Children |
Client Focus
| 48% | Women |
| 32% | Men |
| 30% | Military / Veterans |
| 29% | LGBTQ+ |
| 19% | Persons with Disabilities |