LGBTQ+ Issues therapists in San Jose, CNMI
Browse LGBTQ+ Issues therapists in San Jose, Northern Mariana Islands. Compare credentials, specialties and therapeutic approach. Contact a therapist to learn more.
View nearby cities

LGBTQ+
Jason Herr
Psychologist, Psy.D.
I provide affirming support for LGBTQ+ individuals exploring identity, relationships, and life transitions. Together, we address challenges such as coming out, family dynamics, discrimination, and self-acceptance while strengthening resilience, authenticity, and emotional well-being. My approach is inclusive, compassionate, and grounded in creating a safe space for clients to live fully as themselves.
16 Years Experience
Online in San Jose, CNMI (Online Only)
LGBTQ+
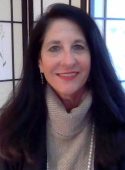
Dr. Carol H Paulson
Psychologist, PhD, LP, RN, APRN, DMin
Exploring your goals for Life and Relationships
44 Years Experience
Online in San Jose, CNMI (Online Only)
LGBTQ+
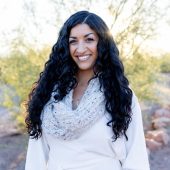
Dr. Amanda Malak
Psychologist, Clinical Psychologist
With special attunement to providing support to LGBTQ+ individuals, I helppeople navigate challenges related to identity, coming out/letting in, relationships, and societal pressures. I support improving communication skills between family members with various belief systems fostering healthy relationships and developing coping strategies to enhance overall well-being. I offer a safe space where people can explore their feelings, choices, build self-acceptance, and address any concerns related to gender and sexual orientation. My approach includes using evidence-based therapies, such as CBT, to help manage issues like anxiety, depression, or discrimination that may arise. I specialize specifically with LGBTQ+ people from conservative backgrounds like conservative Muslims, Mormons, Christians, and many people from the Global South/Majority. Navigating these cultural dynamics adds a complexity that those from more progressive families and cultures may not understand.
12 Years Experience
Online in San Jose, CNMI
LGBTQ+
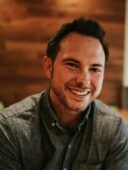
Dr. Mike Strand
Psychologist, PsyD
Members of the LGBTQ+ community often face unique challenges, from navigating personal identity and acceptance to confronting societal prejudice and discrimination. These experiences can lead to feelings of isolation, anxiety, and stress, impacting mental health and well-being. My LGBTQ+ affirming therapy creates a safe and supportive space to explore these issues, offering understanding, validation, and strategies for coping and thriving, embracing your true self with pride and confidence.
18 Years Experience
Online in San Jose, CNMI

LGBTQ+
Dr. Stéphanie Gamache, PhD
Hypnotherapist, PhD
LGBTQ issues often involve navigating identity, desire, intimacy, and belonging within a complex social and relational context. My work offers an affirming, non-pathologizing space for exploration grounded in psychoanalytic and relational understanding. Together, we explore the emotional meanings that shape sexuality, relationships, and self-expression.
7 Years Experience
Online in San Jose, CNMI (Online Only)
LGBTQ+ Issues therapists in San Jose, CNMI Statistics
LGBTQ+ Issues therapists in San Jose, CNMI average 15 years of experience and charge around $218 per session. 100% offer online sessions. The top treatment approaches are Cognitive Behavioral Therapy (CBT) (74%), Acceptance & Commitment Therapy (ACT) (42%), and Psychodynamic Therapy (40%).
Average years in practice
15 Years Experience
Average cost per session
$218
Accept insurance
31%
Offer sliding scale
37%
Gender ID
| 59% |
Female |
|
| 33% |
Male |
|
| 5% |
Non-Binary |
|
| 3% |
Gender Fluid |
|
Session Type
| 57% |
In Person and Online |
|
| 43% |
Online Only |
|
Top Treatment Approaches
| 74% | Cognitive Behavioral Therapy (CBT) |
| 42% | Acceptance & Commitment Therapy (ACT) |
| 40% | Psychodynamic Therapy |
| 38% | Existential / Humanistic Therapy |
| 37% | Multicultural Therapy |
| 36% | Person-Centered Therapy (Rogerian) |
| 32% | Relational Psychotherapy |
Ages Served
| 99% | Adult |
| 79% | Young Adult |
| 55% | Senior |
| 38% | Teen |
| 18% | Children |
Client Focus
| 86% | LGBTQ+ |
| 67% | Women |
| 55% | Men |
| 35% | Black / African American |
| 32% | Hispanic / Latino |