Therapists that treat Teens in Middletown, OH
Browse therapists that treat Teens in Middletown, Ohio. Compare credentials, specialties and therapeutic approach. Contact a therapist to learn more.

Teen
Inner Strength Therapy LLC
Licensed Professional Counselor
Inner Strength Therapy LLC
provides both in-person therapy and online mental health counseling for anxiety, depression, grief, trauma, mood disorders, marriage counseling, and life transitions including divorce, parenthood, retirement, career change, job loss, and more.
Let’s build upon your inner strength
to improve your mental health & well-being
so you can heal, grow, thrive, and live a life you love!
6 Years Experience
In-Person Near Middletown, OH
Online in Middletown, OH

Teen
Ruth Ellerbusch
Counselor/Therapist, LPC, EMDRII
I have been a therapist for nearly 40years, which has taught me a great deal about human struggling and healing. I have developed an expertise in EMDR for the last 27 years. I believe in promoting the deepest, quickest, most complete healing possible. EMDR is the best avenue to achieve this.
38 Years Experience
In-Person Near Middletown, OH
Online in Middletown, OH
Teen
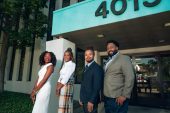
Psychworks Clinic
Psychologist, PHD
At PsychWorks Clinic, our goal is to create a space that is grounded in compassion, cultural awareness, and honesty.
Therapy is a partnership. We work together to unpack the stories you’ve been told and the ones you tell yourself, to find the truth underneath and build something stronger in its place. Whether we're working with a child finding their voice, a couple rebuilding connection, or a man learning it’s okay to feel, growth doesn’t always look like comfort, but it always leads to freedom.
This work is deeply human. And every session, every conversation, is an opportunity to remind someone that they are not broken, they’re becoming.
6 Years Experience
In-Person Near Middletown, OH
Online in Middletown, OH

Teen
Seven Hills Psychology
Psychologist, Psychologist
Welcome to Seven Hills Psychology. We specialize in providing comprehensive psychological services including:
Adult psychotherapy
Couples & family therapy
Child & adolescent therapy
Psychological assessment
18 Years Experience
In-Person Near Middletown, OH
Online in Middletown, OH
Teen
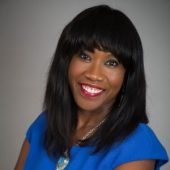
Dr. April Brown - Doctor of Intimacy
Licensed Mental Health Counselor, LMHC, NCC, CST,
"I believe that everyone deserves to feel heard, understood, and supported, no matter where they are in life. Seeking therapy isn't a sign of weakness; it's a courageous step toward understanding yourself, healing from life's challenges, and building healthier relationships.
Through Cape Coral Therapists, Therapists in Sarasota, and my individual practice, my goal is to make meaningful mental health and relationship support more accessible.
Whether we connect in person or virtually, what matters most is creating a safe, compassionate space where you can be yourself, explore your emotions, and work toward the changes you want to see.
Remember, you don't have to have everything figured out before asking for help. Sometimes, the first step toward healing is simply allowing yourself to be supported."
— Dr. April Brown, The Doctor of Intimacy
21 Years Experience
In-Person Near Middletown, OH
Online in Middletown, OH
Teen therapists in Middletown, OH Statistics
Teen therapists in Middletown, OH average 17 years of experience and charge around $207 per session. 100% offer online sessions. The most commonly treated issues are Anxiety or Fears (85%), Depression (76%), and Stress (55%).
Average years in practice
17 Years Experience
Average cost per session
$207
Accept insurance
37%
Offer sliding scale
38%
Gender ID
| 64% |
Female |
|
| 33% |
Male |
|
| 3% |
Non-Binary |
|
Session Type
| 65% |
In Person and Online |
|
| 35% |
Online Only |
|
Top Specialties
| 85% | Anxiety or Fears |
| 76% | Depression |
| 55% | Stress |
| 54% | Trauma and PTSD |
| 49% | ADHD |
| 48% | Loss or Grief |
| 47% | Self Esteem |
Ages Served
| 100% | Teen |
| 96% | Adult |
| 82% | Young Adult |
| 55% | Senior |
| 41% | Children |
Client Focus
| 51% | Women |
| 39% | Men |
| 36% | LGBTQ+ |
| 24% | Black / African American |
| 24% | Military / Veterans |