Therapists that treat Seniors in Niles, OH
Browse therapists that treat Seniors in Niles, Ohio. Compare credentials, specialties and therapeutic approach. Contact a therapist to learn more.
View nearby cities

Senior
Trauma Therapy Company Ohio
Licensed Clinical Social Worker
The Trauma Therapy Company helps trauma victims move from survivor to thriver. We believe in transparency, peer support, collaboration, empowerment, digging deep and the good in humans.
6 Years Experience
In-Person Near Niles, OH
Online in Niles, OH
Senior
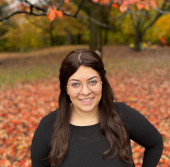
Ayden Ferstenberg
Psychologist, PsyD
I am a licensed psychologist specializing in individual therapy, couples therapy, and sex therapy. I work best with thoughtful, self-aware individuals and couples who might understand themselves and their patterns, but still find themselves stuck in ways they can’t seem to change. In individual therapy, I help you move beyond insight alone to understand the deeper emotional patterns that keep you repeating what you already know you want to change, while developing practical ways to respond differently. In couples therapy, I help partners move beyond repeatedly having the same arguments or understanding each other’s perspectives without actually feeling more connected, so they can create new ways of relating, communicating, and experiencing intimacy. My approach combines practical tools with deeper experiential work to create meaningful, lasting change. Whether you’re struggling in your relationship, feeling disconnected from yourself or your sexuality, navigating the effects of trauma, or simply tired of knowing what you “should” do without being able to do it, I offer a warm, honest, and deeply engaged space to help you get unstuck.
5 Years Experience
Online in Niles, OH (Online Only)

Senior
Allison Lobel
Psychologist, Psy.D.
I believe therapy should be a supportive and collaborative space where people of all ages feel understood and valued. I provide outpatient psychotherapy for children, teens, and adults, drawing from psychodynamic, CBT, and family systems approaches to support meaningful growth and healing. My goal is to help clients navigate challenges, strengthen relationships, and foster resilience in ways that feel authentic and lasting.
19 Years Experience
Online in Niles, OH

Senior
Ruth Ellerbusch
Counselor/Therapist, LPC, EMDRII
I have been a therapist for nearly 40years, which has taught me a great deal about human struggling and healing. I have developed an expertise in EMDR for the last 27 years. I believe in promoting the deepest, quickest, most complete healing possible. EMDR is the best avenue to achieve this.
38 Years Experience
Online in Niles, OH

Senior
Pharion Counseling, LLC
Counselor/Therapist, Licensed Professional Clinical Counselor (LPCC)
I am a 24-year educator and football coach who has brought all of those skills to counseling in order to help people. It is my life's mission to help those who are overwhelmed with life and cannot cope with the stress. I want to help those who live and work hard and sometimes (a lot of the time) take work home with them (you know who you are). I can bring you to better balance, and better life satisfaction.
8 Years Experience
Online in Niles, OH
Senior therapists in Niles, OH Statistics
Senior therapists in Niles, OH average 18 years of experience and charge around $212 per session. 100% offer online sessions. The most commonly treated issues are Anxiety or Fears (81%), Depression (71%), and Stress (56%).
Average years in practice
18 Years Experience
Average cost per session
$212
Accept insurance
38%
Offer sliding scale
32%
Gender ID
| 62% |
Female |
|
| 35% |
Male |
|
| 2% |
Non-Binary |
|
| 1% |
Gender Fluid |
|
Session Type
| 54% |
In Person and Online |
|
| 46% |
Online Only |
|
Top Specialties
| 81% | Anxiety or Fears |
| 71% | Depression |
| 56% | Stress |
| 54% | Trauma and PTSD |
| 52% | Loss or Grief |
| 45% | Self Esteem |
| 40% | Relationship and Marriage Counseling |
Ages Served
| 100% | Adult |
| 100% | Senior |
| 76% | Young Adult |
| 42% | Teen |
| 19% | Children |
Client Focus
| 50% | Women |
| 38% | LGBTQ+ |
| 37% | Men |
| 28% | Military / Veterans |
| 24% | Black / African American |